Amazon CloudWatch is a monitoring and observability service offered by Amazon Web Services (AWS) that provides real-time insights into the performance and health of your applications, systems, and infrastructure resources running on AWS.
CloudWatch collects and stores metrics, logs, and events from various AWS resources and services, including EC2 instances, Lambda functions, RDS databases, and more. This data can be used to monitor resource utilization, application performance, and operational health, as well as to troubleshoot issues and optimize resource usage.
Some of the key features of CloudWatch include:
- Metrics: CloudWatch collects and stores performance data in the form of metrics, which are time-series data points that represent the behavior of a resource over time. Metrics can be used to monitor resource utilization, track application performance, and identify trends and anomalies.
- Alarms: CloudWatch can create alarms based on metric data to notify you when a threshold has been breached or an anomaly has been detected. Alarms can be used to trigger actions such as autoscaling, sending notifications, or executing AWS Lambda functions.
- Logs: CloudWatch also collects and stores logs from various AWS resources and services, including EC2 instances, Lambda functions, and more. Logs can be used to troubleshoot issues, debug applications, and monitor security events.
- Events: CloudWatch Events provides a way to monitor events and triggers in real-time, and to route them to various AWS services for processing. Events can be used to automate workflows, trigger alerts, or execute AWS Lambda functions.
Overall, CloudWatch provides a comprehensive monitoring and observability solution that can help you to operate and optimize your AWS infrastructure and applications more effectively.
How do AWS CloudWatch works?
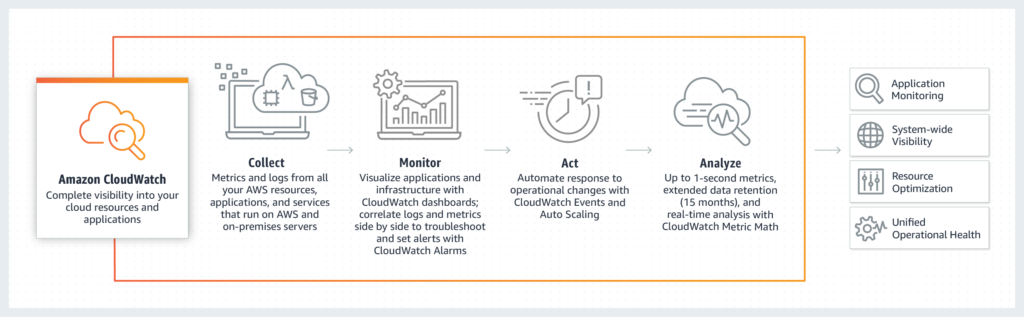
AWS CloudWatch works by collecting and monitoring metrics, logs, and events from various AWS resources and services. It provides a centralized platform for monitoring, logging, and analyzing AWS resources in real-time.
Here are the key components of AWS CloudWatch and how they work:
- Metrics: CloudWatch collects and stores metrics for various AWS resources such as EC2 instances, RDS databases, and ELB load balancers. Metrics are numerical data that represent the performance and behavior of AWS resources. CloudWatch Metrics can be used to set alarms, visualize data, and troubleshoot issues.
- Alarms: CloudWatch Alarms can be set up to monitor metrics and take automated actions based on defined thresholds. Alarms can be configured to notify you via email, SMS, or other methods when a threshold is breached.
- Logs: CloudWatch Logs allows you to centralize, search, and analyze logs generated by AWS resources such as EC2 instances, Lambda functions, and VPC flow logs. You can use CloudWatch Logs to troubleshoot issues, monitor application performance, and audit security.
- Events: CloudWatch Events enables you to respond to changes in AWS resources by triggering automated actions. You can configure CloudWatch Events to trigger AWS Lambda functions, SNS notifications, or other actions based on specific events or patterns.
Overall, AWS CloudWatch provides a powerful set of tools for monitoring and managing AWS resources in real-time. By leveraging CloudWatch metrics, alarms, logs, and events, you can proactively monitor and optimize your AWS infrastructure.
Source: AWS
Let’s checkout some sample questions on AWS CloudWatch.
1. What is CloudWatch?
A. A service that provides real-time insights into the performance and health of your applications, systems, and infrastructure resources running on AWS.
B. A service that allows you to manage DNS records for your domains.
C. A service that provides data warehousing and analytics capabilities for big data.
2. What types of data can CloudWatch collect and store?
A. Metrics, logs, and events.
B. Configuration files, scripts, and executables.
C. Databases, tables, and queries.
3. What is a CloudWatch metric?
A. A time-series data point that represents the behavior of a resource over time.
B. A configuration file that defines the settings for a resource.
C. A database table that stores performance data for a resource.
7. What is a CloudWatch alarm?
A. A notification that is triggered when a threshold has been breached or an anomaly has been detected.
B. A script that is executed when a resource fails to start.
C. A report that is generated when a resource reaches a certain level of usage.
6. How can CloudWatch logs be used?
A. To troubleshoot issues, debug applications, and monitor security events.
B. To configure and manage resources running on AWS.
C. To create data warehouses and perform big data analytics.
7. What is CloudWatch Events?
A. A service that provides a way to monitor events and triggers in real-time, and to route them to various AWS services for processing.
B. A service that provides real-time streaming of data from various sources.
C. A service that provides a scalable and highly available data warehouse for big data.
Answers:
- A
- A
- A
- A
- A
- A
AWS CloudWatch Glossary
Here are some common terms and concepts related to AWS CloudWatch:
- Metrics: A metric represents a time-ordered set of data points that describes the values of a specific resource over time.
- Namespace: A namespace is a container for CloudWatch metrics. Each metric must be defined in a namespace.
- Dimension: A dimension is a name/value pair that helps you to uniquely identify a metric.
- Alarm: An alarm watches a single metric over a specified time period and performs one or more actions based on the value of the metric relative to a threshold over time.
- Logs: CloudWatch Logs allows you to monitor, store, and access your log files from Amazon EC2 instances, AWS CloudTrail, and other sources.
- Log group: A log group is a collection of log streams that share the same retention, monitoring, and access control settings.
- Log stream: A log stream represents a sequence of log events that share the same source.
- Event: A CloudWatch Events rule matches incoming events and routes them to one or more targets for processing.
- Dashboard: A dashboard is a customizable home page in the CloudWatch console that provides an overview of your AWS resources and applications.
- Agent: The CloudWatch agent is a software package that runs on an EC2 instance to collect and send metrics and logs to CloudWatch.
AWS CloudWatch Logs
AWS CloudWatch Logs is a service provided by Amazon Web Services (AWS) that allows users to monitor, store, and access log files from their AWS resources and applications. With CloudWatch Logs, users can collect and analyze log data from a variety of sources, including AWS services, operating systems, and applications. This data can then be used for troubleshooting, performance monitoring, security analysis, and more.
CloudWatch Logs works by collecting log data from various sources and storing it in a centralized location. Users can then search, filter, and analyze this data using CloudWatch Logs Insights, a query language and log analysis tool. Insights allows users to run complex queries on their log data, visualize the results, and create custom dashboards and alarms to monitor specific metrics or events.
CloudWatch Logs also offers a range of features for managing log data, including automated retention and deletion policies, export to other AWS services such as S3, and integration with AWS Lambda functions for real-time processing and alerting. Additionally, CloudWatch Logs integrates with other AWS services such as Amazon Elastic Compute Cloud (EC2), AWS Lambda, and AWS Elastic Beanstalk, allowing users to collect and analyze log data from a variety of sources in a single interface.
Overall, AWS CloudWatch Logs is a powerful tool for managing and analyzing log data in AWS environments, and can provide valuable insights into the performance, security, and reliability of AWS resources and applications.
Log collection and management using AWS CloudWatch Logs
WS CloudWatch Logs is a fully managed service that helps you to collect, monitor, and analyze log data generated by your applications, systems, and services. It allows you to store your logs centrally and retrieve them for further analysis. AWS CloudWatch Logs also provides real-time log data insights, allowing you to quickly identify and troubleshoot issues.
To collect logs, you can use AWS-provided agents or SDKs, or you can use your own custom scripts. AWS CloudWatch Logs supports logs from various sources, such as Amazon EC2 instances, AWS CloudTrail, VPC Flow Logs, and more. Once you have collected the logs, you can then store them in CloudWatch Logs.
You can create log groups to organize your logs and apply retention policies to manage log storage costs. AWS CloudWatch Logs also provides a range of features to help you search, filter, and analyze your log data. You can use CloudWatch Logs Insights to query and visualize your logs data in real-time, and create alarms to notify you when certain log events occur.
Insights and analysis of log data
Insights and analysis of log data involves analyzing log data to gain insights and identify patterns, anomalies, and potential issues. This is an important aspect of monitoring and troubleshooting applications, services, and infrastructure in the cloud. AWS CloudWatch Logs Insights is a service that enables you to search, analyze, and visualize log data in real-time.
With CloudWatch Logs Insights, you can perform queries to analyze log data and extract valuable insights. You can use the AWS Management Console or the AWS Command Line Interface (CLI) to create queries, and then execute them against your log data. You can use filters, regular expressions, and aggregation functions to narrow down your results and gain insights.
CloudWatch Logs Insights supports a range of visualization options, including line charts, stacked area charts, and scatter plots. These visualizations enable you to quickly identify trends and patterns in your log data. You can also export your query results to Amazon S3, Amazon Kinesis Data Firehose, or Amazon CloudWatch Metrics for further analysis and integration with other AWS services.
CloudWatch Logs Insights integrates with CloudWatch Logs, allowing you to easily analyze and monitor your log data. You can configure CloudWatch Logs to stream your logs to CloudWatch Logs Insights, or you can use the CloudWatch Logs Insights API to push log data to the service.
Overall, insights and analysis of log data are essential for monitoring and troubleshooting applications and infrastructure in the cloud. Further, AWS CloudWatch Logs Insights provides a powerful set of tools for analyzing log data, enabling you to gain valuable insights and take proactive measures to improve the performance and reliability of your applications and services.
AWS CloudWatch Alarms and Actions
AWS CloudWatch Alarms and Actions allow users to set alarms on CloudWatch metrics and execute automated actions when alarms are trigger. These actions can include sending notifications, running AWS Systems Manager Automation documents, or invoking AWS Lambda functions.
Users can create CloudWatch alarms based on the desired metric, such as CPU usage or network traffic, and specify the threshold for triggering the alarm. When the metric value crosses the specified threshold, the alarm changes state and triggers the specified action.
AWS CloudWatch Alarms and Actions can be use to perform automated actions for various use cases, including scaling EC2 instances, stopping and starting instances, creating snapshots, and sending notifications to an SNS topic or an email address.
Overall, AWS CloudWatch Alarms and Actions can help users to monitor and respond to events in real-time, automate responses to common events, and maintain the availability and performance of their applications and services running on AWS.
AWS CloudWatch API and CLI
AWS CloudWatch provides APIs and command-line interface (CLI) tools that allow developers and administrators to automate CloudWatch tasks programmatically. The APIs enable programmatic access to CloudWatch data and allow developers to integrate CloudWatch functionality into their own applications. The CLI is a command-line tool that provides an interface for interacting with CloudWatch services from a terminal or command prompt. It is useful for scripting and automating tasks that need to be perform on a regular basis. The AWS SDKs (Software Development Kits) are also available for various programming languages, providing language-specific interfaces for working with CloudWatch services.
CloudWatch Pricing and Cost Optimization
Here are some pricing considerations and cost optimization tips for using AWS CloudWatch:
- Understand the pricing model: AWS CloudWatch pricing is based on the number of metrics, alarms, logs, and events that you use. It’s important to understand how each of these components is priced, as well as any additional charges for data storage and data transfer.
- Use the free tier: AWS CloudWatch offers a free tier that includes 10 custom metrics, 10 alarms, and 5 GB of log data ingestion per month, along with some other usage limits. If you’re just getting start with AWS CloudWatch, make sure to take advantage of the free tier.
- Use filters to reduce log data ingestion: AWS CloudWatch Logs charges based on the volume of log data ingested, so it’s important to filter out unnecessary log data. You can use CloudWatch Logs filters to specify which log events to include or exclude based on keywords, patterns, or other criteria.
- Use CloudWatch Events to trigger actions: AWS CloudWatch Events can be use to trigger actions in response to events in your AWS environment. By using CloudWatch Events to automate tasks and workflows, you can reduce the need for manual intervention and save time and resources.
- Use CloudWatch metrics and alarms to monitor resource utilization: By using CloudWatch metrics and alarms, you can monitor resource utilization and set alerts for when resource usage exceeds certain thresholds. This can help you proactively identify and address performance and cost issues.
- Consider using third-party tools for log analysis: While AWS CloudWatch LogsInsights provides powerful log analysis capabilities, it can be expensive for large volumes of log data. Consider using third-party log analysis tools that may be more cost-effective for your use case.
CloudWatch Use Cases
Here are some common use cases for AWS CloudWatch:
- Application Monitoring: With CloudWatch, you can monitor your application’s performance and availability by collecting and tracking metrics such as CPU usage, memory usage, and network traffic. You can set alarms to notify you when metrics cross predefined thresholds.
- Resource Monitoring: AWS CloudWatch can be use to monitor AWS resources such as EC2 instances, RDS instances, and Lambda functions. You can monitor resource utilization and set alarms to alert you when usage crosses predefined thresholds.
- Log Analytics: AWS CloudWatch can be use to collect and analyze log data from your applications and infrastructure. You can create custom metrics based on log data, and use CloudWatch Logs Insights to search and analyze log data in real-time.
- Cost Optimization: CloudWatch can help you optimize costs by identifying unused resources and providing insights into resource utilization. You can use CloudWatch to monitor the cost of your resources and identify cost-saving opportunities.
- Security Monitoring: CloudWatch can be use to monitor security events and detect unauthorized access to your resources. You can set alarms to notify you when security events occur, and use CloudWatch Logs Insights to analyze log data for security-related events.
- DevOps Monitoring: CloudWatch can be use to monitor DevOps processes and workflows. You can collect and track metrics on build times, deployment frequency, and code quality. This information can be use to optimize your DevOps processes and improve overall application quality.
- Business Analytics: AWS CloudWatch can be use to collect and analyze business metrics such as sales, revenue, and customer usage. You can create custom metrics and use CloudWatch to track these metrics over time.
How to set up and configure AWS CloudWatch?
Setting up and configuring AWS CloudWatch involves the following steps:
- Create an AWS account: If you do not have an AWS account, you will need to create one. To do this, go to the AWS website and follow the instructions to create a new account.
- Set up AWS CloudWatch: Once you have an AWS account, log in to the AWS Management Console, and search for “CloudWatch.” From there, you can create dashboards, alarms, and configure other settings.
- Choose the services to monitor: AWS CloudWatch can monitor a wide variety of AWS services, including Amazon EC2 instances, Amazon RDS databases, and Amazon S3 buckets. Choose the services you want to monitor and configure CloudWatch to collect and analyze their metrics.
- Set up CloudWatch alarms: CloudWatch alarms allow you to receive notifications when specific metrics cross a threshold you have defined. You can configure alarms to send notifications to email addresses, SMS messages, or other endpoints.
- Configure CloudWatch logs: CloudWatch logs allow you to collect, monitor, and analyze logs from your AWS resources. To configure CloudWatch logs, you will need to install an agent on your resources and set up log groups.
- Optimize costs: Finally, you may want to optimize the cost of using CloudWatch. AWS offers various cost optimization strategies, such as using custom metrics and disabling unnecessary alarms.
So, if you’re planning to use AWS CloudWatch it’s a good idea to learn more about it. Knowing what you’re about to integrate will help you tap into the full potential of AWS CloudWatch and achieve smooth application execution.