
Self-service reporting methods are being considered by organisations. Executives want to get the most out of their IT investments. Product teams want to deliver best-in-class analytics. Not all (but many) paths lead back to Azure Power BI Embedded as a mechanism to apply in-context analytics to a wide range of use cases. We’d be remiss if we didn’t add that there are other ways to distribute and embed Azure Power BI reports in Sharepoint—or publish a report publicly—but for now, we’re focused on the Power BI Embedded analytics solution.
Let us get an Overview of Azure Power BI Embedded Services!
About Power BI Embedded Services
Power BI Embedded is a Microsoft Azure Platform-as-a-Service (PaaS) solution that provides a set of APIs for integrating Power BI material into bespoke apps and websites. All of the features, such as cross-filtering, Row Level Security, and Q & A, are available. You may use a normal Power BI Desktop to create reports. However, you are no longer confined to posting your reports to the Power BI service. Power BI Embedded also allows you to incorporate them into your own web and mobile apps. Not just for your company, but also for third-party users. They don’t even need to have a Power BI license.
This may be familiar to some as Power BI Workspace Collections. However, this Azure service was decommissioned in June 2018, and Power BI Embedded took its place. Microsoft even began to refer to Workspace Collections as “Embedded Version 1.” It featured relatively limited features at the time, such as only two data connections, no bookmarks, and no Q&A, as well as a specialised API. Power BI embedded is now inextricably tied with the well-known Power BI, giving the same functionality and utilising the same API.
Target audience of Power BI Embedded
On its webpage, Microsoft specifically acknowledges independent software vendors (ISVs), which are organisations that build and sell their own software solutions. They may utilise Power BI Embedded as a method to provide Power BI data to their clients via their own app.
Many non-software firms may benefit from the capabilities of Power BI Embedded by providing information to their clients or partners in a more simplified and visually appealing manner. Consider a bank that employs excellent visuals in its mobile app to display you account activity, along with the interactive filtering provided by Power BI. Alternatively, a facilities management company can display businesses the actual expenditures and services incurred each month, including the option to drill down from city to building to single rooms.
Finally, businesses may utilise Power BI Embedded to provide reports to their employees without supplying each one with a Power BI Pro licence. This is closely connected to the following chapter, which goes into further depth about Power BI Capacities. Microsoft recommends purchasing a Power BI Premium licence for the firm. A Power BI “A” SKU, on the other hand, maybe sufficient if you merely wish to incorporate Power BI reports into an internal information site without requiring SharePoint or Power BI Service.
Pricing
First and foremost, you must have at least one Power BI Pro licence (details discussed in the next chapter). Furthermore, only Power BI Pro users may publish reports. As I write this, Power BI Pro costs € 8.40 or $ 9.99 per user each month. This should be enough for your first steps. When you register a new app in Azure AD, you will be given a limited number of complimentary embedding tokens. If you intend to enter a productive state, you will require Power BI embedded capabilities. This must be allocated to the App Workspace where your Power BI material is kept.
What capacities are available?
SKUs (stock-keeping units) are used to specify capacity, which includes the A-SKU, EM-SKU, and P-SKU. All of them are subdivided into many node kinds, each with a distinct peak render capacity (page refresh, filtering, slicing/dicing) per hour. The distinction may be found here, with the following important takeaways:
An SKU: “Azure” SKU. It is available for purchase through the Azure Portal and is invoiced on an hourly basis. If you only want to try Power BI Embedded, this is the lowest option. Because there is no commitment, you can halt or stop at any moment, as well as scale-up and down. However, it can only be used to integrate the material into your own application. Pricing starts at $1.0081 per hour and may go up to $32.26 per hour if the maximum capacity is required.
EM SKU: EM SKU may be acquired using the Microsoft Office 365 Administration Portal. It has a set monthly rate and may only be purchased for a full year in advance. It allows you to integrate the material into your own application. Users of Power BI FREE may also view embedded material in Share Point Online and Microsoft Teams. Pricing begins at around $ 650 per month and provides for up to 300 renderings each hour.
P SKU: P SKU is also available for purchase through the Office 365 Administration Portal. It allows you to provide Power BI FREE customers with access to Power BI Service in addition to the features of the EM SKU. However, you must commit for a full year and pay at least $ 5000 every month. It can handle up to 2400 renderings per hour and can be pushed much higher.
Which one is best?
First and foremost, you must determine if you want to commit for a full year and whether you require any Microsoft services such as Power BI Service or Sharepoint. If not, or if you simply want to try to incorporate a report into your app, start with the A SKU. Microsoft has also issued a whitepaper to assist you in determining which one is better in this situation.
However, if you anticipate having 24/7 availability, adopting the EM SKU may be less expensive in the long run than using the A SKU. P SKU is only required if you foresee a large number of people to access your report or if you don’t want to miss out on the Power BI Service. Because so many elements must be examined, it is just impossible to provide clear guidance here. It is entirely depending on your situation.
How do you create an application with an embedded Power BI report?
When it comes to Power BI Embedded, Microsoft utilises the words “App owns data” and “User owns data.” The primary distinction is that “User owns data” implies that every customer must have a Power BI licence. This is frequently not the case when you wish to provide Power BI reports to your clients. So I’ll concentrate on the ‘App owns data’ use case.
Setting up the Power BI and Azure Environment
Assume you now have the ability to incorporate your Power BI resources. What should you do next in order to incorporate your report? The obvious first step is to: Make a report that you want to embed. You can do this with Power BI Desktop and whatever functionality you desire, such as Row Level Security, custom visualisations, or bookmarks.
You must then create an environment in order to integrate this report into your custom app. Fortunately, a wizard can help you with this. This will walk you through every step required to prepare Power BI for embedding.
After logging in to your Power BI Pro account, you may configure API access. You will be in need to register the app in Microsoft Azure AD as soon as you click to register. The Azure Portal is also where you can see and modify its settings. Simply search for App registrations in Azure Active Directory and you should be able to discover it.
Azure AD-registered applications, including our freshly formed PBIE Customer Example. The next two steps will assist you in configuring your Power BI service by creating an App Workspace and importing your report into it. You may also skip them if you are already familiar with Power BI Service and have uploaded your report there. Please keep in mind that you must manually publish your App Workspace as a Power BI App.
The fifth and last stage in configuring your environment is to provide permissions to the app. You could accomplish this manually (via the Azure Portal), but it is now as simple as clicking a button. That’s all. You are now free to include your Power BI reports in your own app. You may also download an example web app with your parameters prefilled to test things.
Setting up your Application
Let’s pretend you already have a wonderful app for your clients or coworkers to utilise. Or you’re going to construct it from the ground up but already know how to accomplish it. You just want to add the material that you prepared in Power BI. Depending on the technology, you may utilise the.NET SDK, the JavaScript API, or the Power BI Rest API as the most general option. I’ll attempt to demonstrate the principles here regardless of your favourite technology.
Authentication
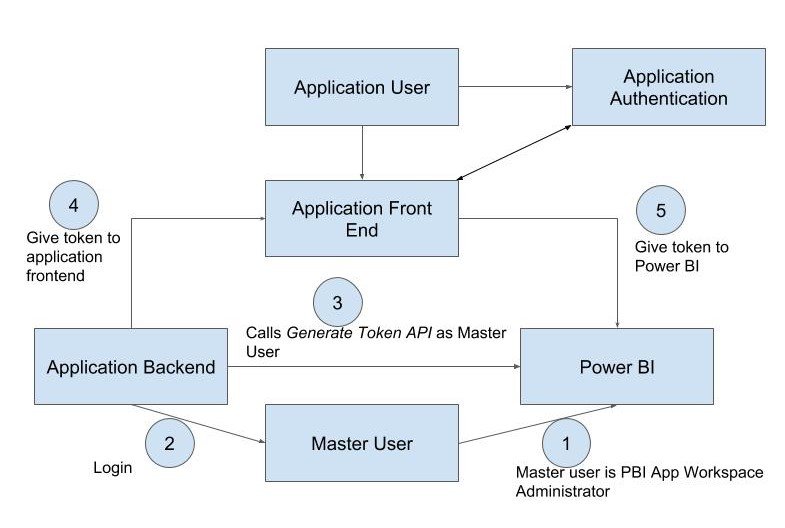
You most likely have some type of user management system in place to govern access to your data. The user who wants to view the page with the integrated report usually logs in using the application front end. In the application backend, you must now initiate token generation by logging in as the master user who owns the Power BI App Workspace. This token is sent to the report consumer’s frontend, allowing it to access the Power BI API. The reports that are visible to the master user maybe incorporate into your application in this manner, and the user can see everything that the master user can see.
You may also use this way to apply the Row Level Security idea (RLS). This implies that you generate a single report for each user to view, but each user can only access particular rows of this report based on his or her job. A team leader, for example, can only access data for his or her team. Power BI Desktop or an underlying Tabular model is often used for configuration, while Power BI Service is used for role assignment. Typically, Power BI obtains role information from the AD user. Because not every user of your app has one of these, you must send this information in another means. The technique to accomplish this is to extend the previously specified authentication token.
It now requires, in addition to information about your master user, a JSON array including the consumer’s username, roles, and appropriate datasets.
Embedding your Azure Power BI content
The.NET SDK or the JavaScript API are the simplest ways to integrate Power BI material into your programme. If those two options aren’t suitable for you, you can use the Power BI REST API from within your application. This gives you greater freedom, but several useful elements, particularly in terms of layouts, are not available. Because the code used is significantly dependent on your language, I’ll only share some samples here:
Display reports and dashboards: You can obviously load and display dashboards and reports within your own application. These will employ the same features as ordinary Power BI Service material.
Set Filters and Slicers: If you embed a report, you can also adjust the filters from within your application, rather than from the report itself. In this manner, you may even accomplish something that Power BI Service does not allow, such as filtering across several reports.
Manipulate Datasets: In your application, you may allow the application used to obtain information about certain datasets. You may also allow or disable the ability to contribute rows to these datasets.
Final words
Microsoft provides a wealth of decent code to assist you in developing your first application with incorporated Power BI information. Even if you are not a developer, the Javascript API and.NET SDK are both excellent places to start for your development team. Because Microsoft concentrates on the documentation of their SDKs, it may be a bit more difficult to acquire initial results if you are not utilising any of these technologies. When 24/7 availability is required, employing the “A” SKU might become rather costly. It is also difficult to determine the appropriate capacity since peak renders per hour are difficult to forecast.