Amazon Quicksight, according to the AWS website, is “a rapid, cloud-powered business intelligence solution that makes it easy to distribute insights to everyone in your organization.” This is accomplished through gorgeous visualizations and interactive dashboards that provide real-time machine learning (ML) insights to your company’s decision-makers. It is critical to thoroughly comprehend what QuickSight has to offer in contrast. We will put the facts at your fingertips to help you determine whether QuickSight is ideal for your firm.
What is Amazon QuickSight?
Amazon QuickSight is a cloud-based machine learning-powered business analytics tool provided by Amazon Web Services. It helps businesses to make better data-driven decisions. The Amazon QuickSight BI utility allows organizations to build and evaluate data visualizations, as well as extract simple insights to help them make business decisions.
These dynamic dashboards may be easily integrated into a variety of apps, portals, and websites. Because Amazon QuickSight is scalable, it can serve thousands of users without the need for extra infrastructure management or capacity planning. It is also device-independent.
What is Amazon QuickSight used for?
Amazon QuickSight helps businesses to access and explore deeper insights in a visually dynamic environment. It incorporates natural language query functionality, branded QuickSight Q, so users can ask their data inquiries in simple English. BI teams would no longer be required to pre-build data models on specific data sources.
Q improves as more people use it, owing to its built-in glossary and feedback system. The BI platform explains these insights in layman’s terms to everyone who needs them, even if they lack data science skills. Users may also predict outcomes using features such as anomaly identification and forecasting.
How to Analyze Data with Amazon QuickSight
Amazon QuickSight generates interactive dashboards and insights in a few simple steps:
Collect and load data
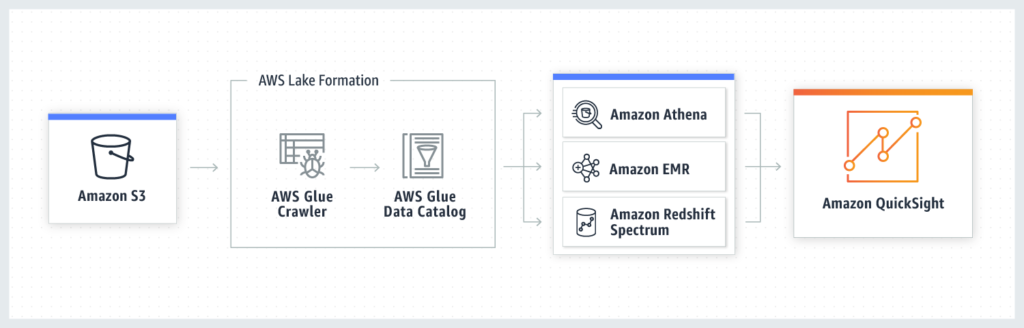
Amazon QuickSight retrieves and reads data from a variety of Amazon services, including Aurora, Athena, Redshift, Simple Storage Service (S3), and Elasticsearch Service 7.7. It also supports on-premises databases, file uploads, and API-based data sources such as Salesforce. There is also support for click streams, sales orders, IoT devices, and financial data. End-users can utilize Amazon QuickSight to submit incremental data in the form of a file or an AWS S3 bucket.
Connect to data
Amazon QuickSight links to data in any place, including the AWS cloud, corporate data centers, SaaS, third-party apps, CSV/XLSX/JSON files, and so on. Amazon prepares data for analysis by filtering it, renaming fields for improved reading, altering data types (if necessary), adding calculated fields, and constructing SQL queries.
Analyze data
Amazon QuickSight links to data in any place, including the AWS cloud, corporate data centers, SaaS, third-party apps, CSV/XLSX/JSON files, and so on. Amazon prepares data for analysis by filtering it, renaming fields for improved reading, altering data types (if necessary), adding calculated fields, and constructing SQL queries.
Create visualizations
QuickSight generates graphics that users may organize and personalize. Furthermore, it does away with the necessity for users to do manual extract, convert, and load procedures. The platform provides interactive dashboards, email reports, and integrated analytics for business users to get insights and take appropriate decisions. In addition, the QuickSight workspace includes dynamic graphs, charts, tables, tales, sheets, and a variety of other graphics. Users may see and create dashboards within their corporate apps using embedded analytics.
The top 5 things to know about Amazon QuickSight
- QuickSight’s platform is secure, with multi-region availability and built-in redundancy, allowing customers to distribute dashboards and insights to numerous users.
- An analysis is a workspace where people develop and interact with graphics. They may see, organize, and calibrate a variety of graphical data displays, such as interactive graphs, charts, and tales, from this location.
- The SPICE engine dynamically duplicates data while protecting the underlying data architecture, allowing numerous users to do quick, interactive analysis at the same time.
- Users can leverage ML and natural language capabilities to uncover hidden patterns; discover outliers and significant business drivers; and even if they lack technical competence or ML experience, do what-if analysis and forecasting
- Use Amazon SageMaker’s machine learning models to create predictive dashboards without writing any code.
Benefits
Amazon QuickSight is a fully managed cloud-based solution that can aggregate data from several sources and display it in a single dashboard. It has the following benefits.
- QuickSight does not need sophisticated server configurations, data models, or capacity planning, allowing customers to be up and running quickly. Scale up the deployment of new ML-powered BI dashboards for faster insights and better decision-making.
- SPICE, QuickSight’s in-memory computation engine, replicates data automatically for high availability while saving time, money, and resources.
- Users will experience no upfront licence charges with a pay-per-session basis for dashboard readers (consumers).
- Users may create interactive visualisations and dashboards and integrate them in apps and web portals without writing any code by using single sign-on (SSO) and APIs.
- QuickSight supports a wide range of data sources, allowing users to gain insights from SaaS apps, third-party databases, native AWS services, private Amazon virtual private cloud (Amazon VPC) subnets, and more.
- Distribute dashboards and insights to numerous users in a safe manner, and manage users and information using role-based access management and SSO. QuickSight also adheres to a number of industry standards, including HIPAA, FedRAMP, and security operations centres.
- QuickSight Mobile allows consumers to gain insights from their data on any device and from any place. Drill-downs, filters, predictions, email alerts, and collaborative viewing and sharing are all part of the mobile-optimized experience.
Pricing
Amazon QuickSight is the first business intelligence solution to provide pay-per-session pricing. Companies only pay when their employees view dashboards or reports. This makes large-scale deployments incredibly cost-effective.
QuickSight is available in two flavors:
Standard Edition
Personal data exploration and analysis are Only available to writers for $9 per month with an annual membership ($12 per month for month-to-month payments).
Enterprise Version
Delivers information at a large scale, Both authors (dashboard publishers) and readers can use it. Readers per user pricing: $5 per month per user, Pricing for reader session capacity is $250 per month for 500 sessions. Authors’ per-user cost is $18 per user per month with an annual membership ($24 per user per month for month-to-month payments).
Alerts and anomaly detection are also supported by QuickSight (threshold-based or automatic). This add-price-on is clear and based on measures that have been analyzed.
QuickSight’s Visual Presentations
The focus of QuickSight is on aesthetics. Although more costly BI tools, such as Tableau, provide more visualization choices in terms of quantity, QuickSight’s fundamental visual presentations are more attractive. This gives you a huge edge when interacting with clients and consumers. A typical QuickSight visual presentation includes the following elements:
Analyses
The workspace where you produce and interact with graphics is referred to as an “analysis” by QuickSight. You may organize and calibrate a variety of graphical data presentations in this study, such as interactive graphs and charts linked to performance measures, sales analytics, or cost analyses. A “narrative” can also be included.
Visuals
A visual is a graphical representation of information. It might be a graph, chart, table, or diagram. Newly produced graphics are launched in “AutoGraph” mode. AutoGraph employs an algorithm to select visual presentations for the data you enter. You may then create your visualizations by choosing from options such as heat maps, treemaps, combination charts, pivot tables, and more. You may also modify the colors, apply filters, and rearrange the order of the elements.
Insights
Insights provide insightful interpretations of the facts in your “analysis.” After evaluating your data, QuickSight’s Enterprise Edition will automatically propose relevant machine learning insights – and data presentations.
Sheets
Sheets are graphic groupings that appear on a single page. You’ll insert the selected graphics onto the sheet as if it were the front page of a newspaper while doing an analysis. Your analysis can comprise many sheets, each with its visuals that function together or individually.
Stories
A narrative allows you to collect many graphics or “scenes” that you may exhibit on the sheet in the same way as a slideshow does. Users may view various components of the analysis by scrolling through the story’s scenes. The sceneries aren’t static; they update in real-time, much like the rest of the dashboard’s graphs, charts, and statistics.
Final Words
QuickSight supports AWS data, third-party data, big data, spreadsheet data, SaaS data, B2B data, and more sources. If you have data, QuickSight can help you create dynamic dashboards and make your data seem fast. QuickSight provides an easy-to-use interface via which users can simply connect their data, produce analyses and visualizations, and then publish those findings to an interactive dashboard, which customers can browse or embed into other websites and apps.