Learn to Visualize data from Azure Monitor
This tutorial will help you in learning how can you visualize data using azure monitor and can see that in an interactive and attractive manner. You can use Workbooks, Azure dashboards, Power BI, Grafana, Azure monitor views or can build your own Custom Application for this purpose. Visualizations such as charts and graphs can help you analyze your monitoring data to drill-down on issues and identify patterns. Depending on the tool you use, you may also have the option to share visualizations with other users inside and outside of your organization.
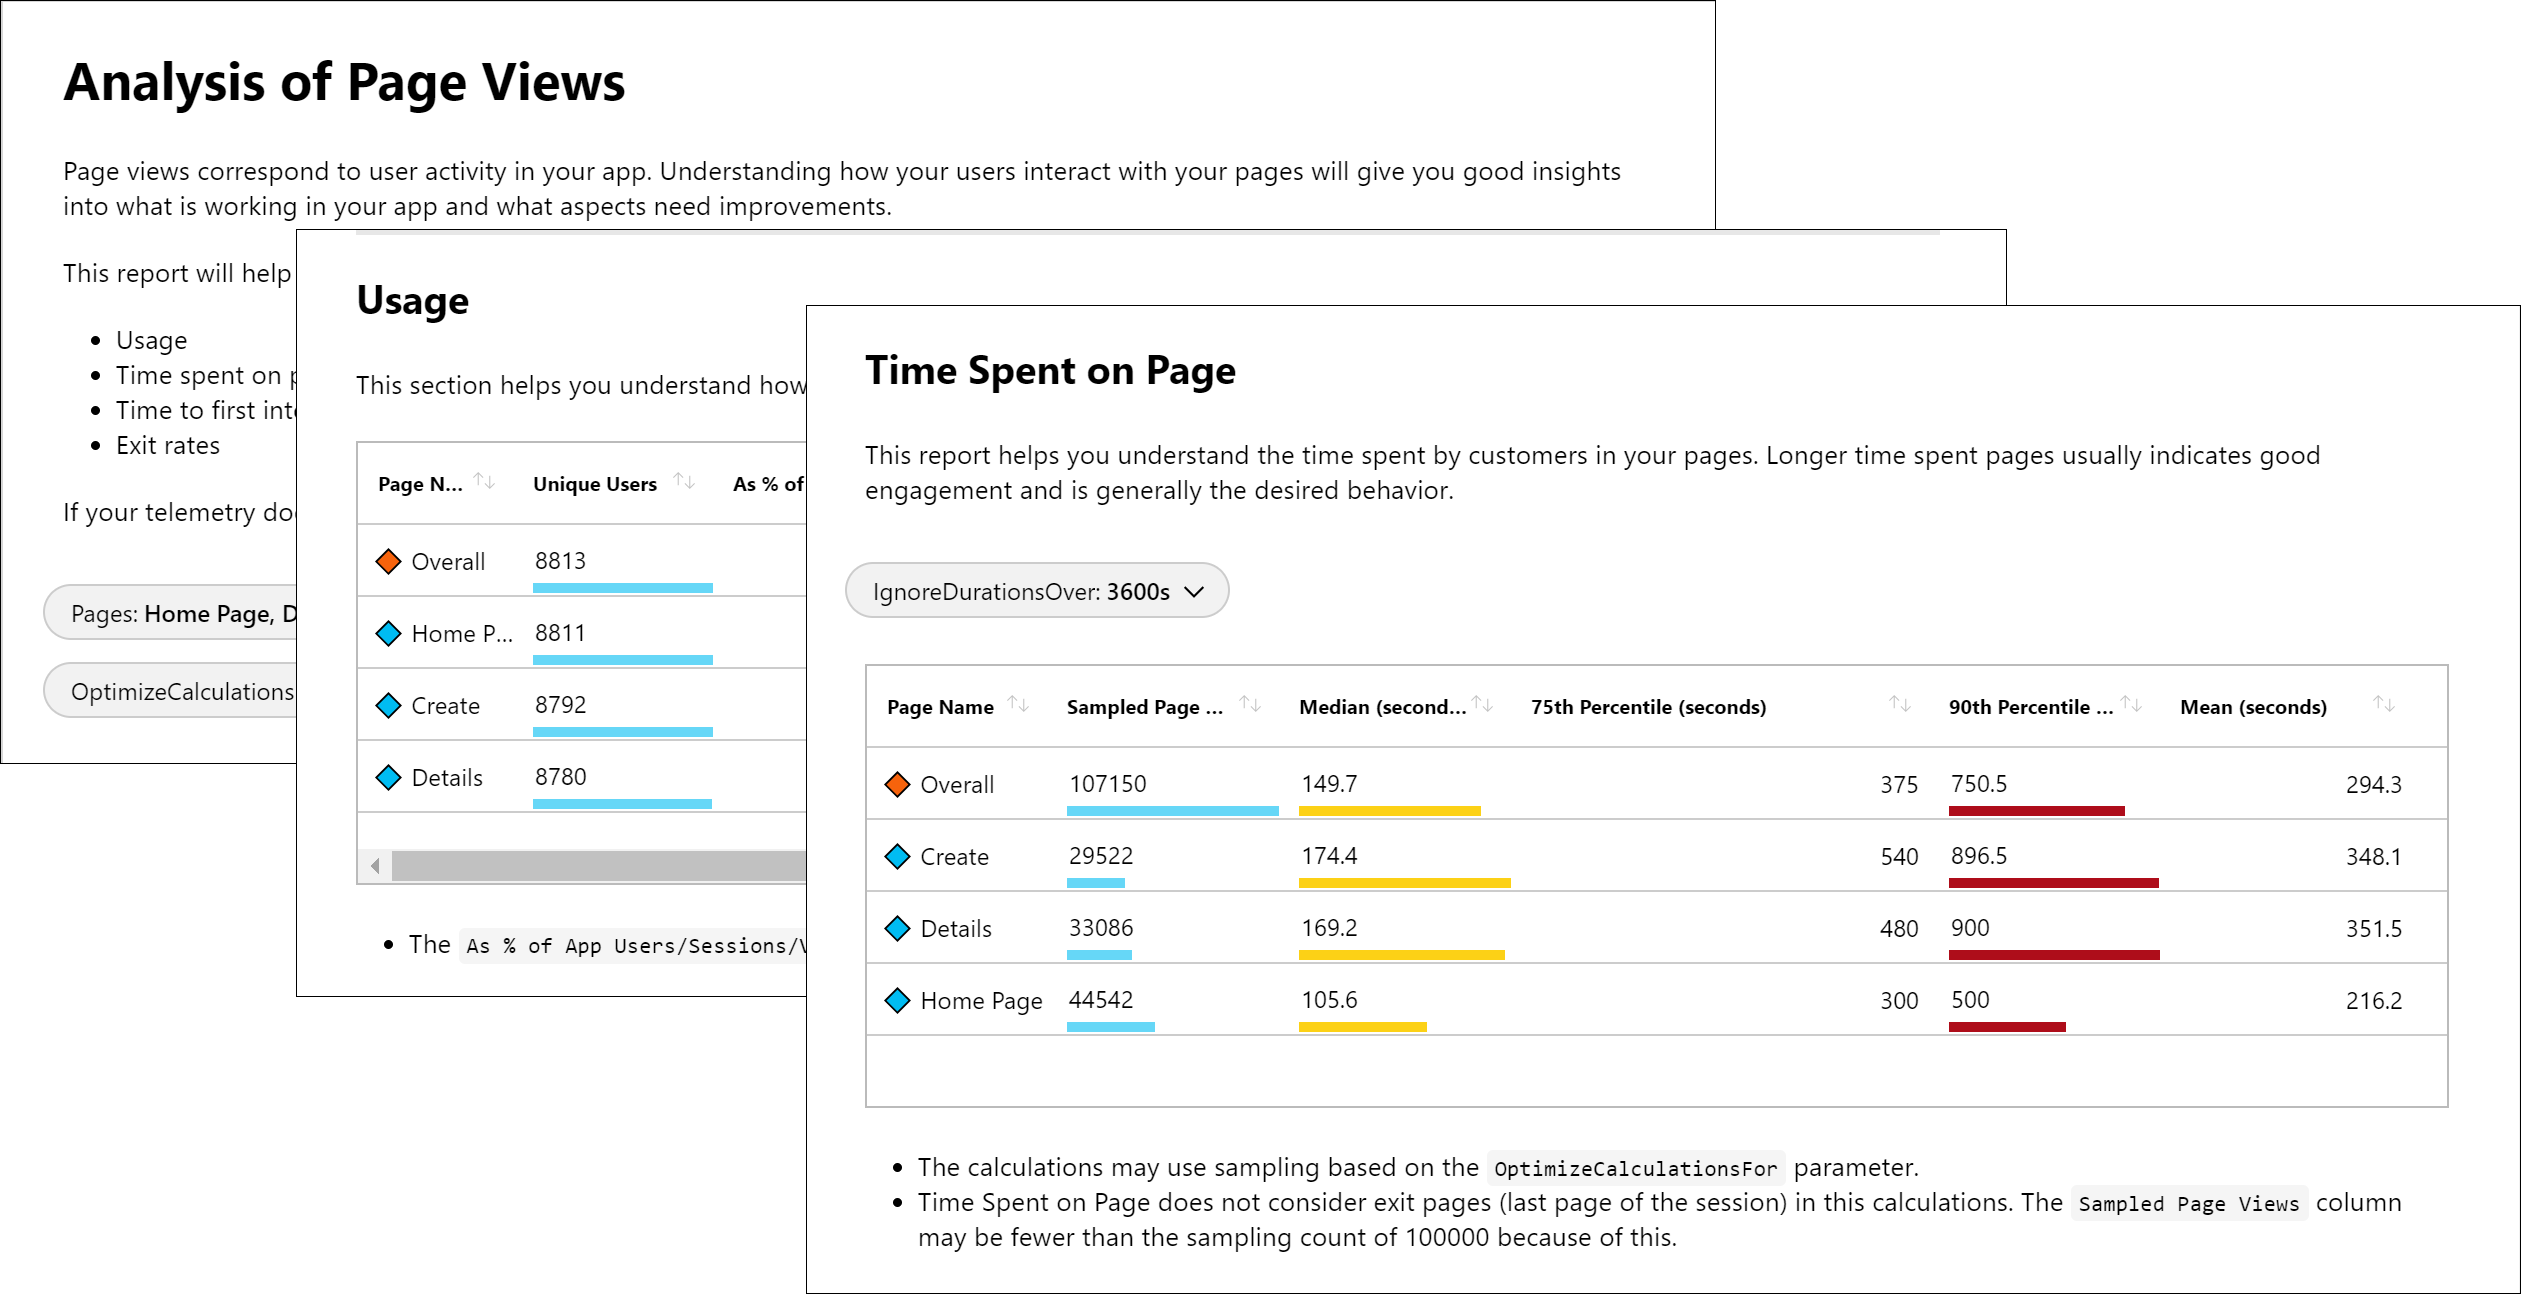
Using Workbooks
Workbooks are interactive documents that provide deep insights into your data, investigation, and collaboration inside the team. Some of the examples where workbooks are useful are troubleshooting guides and incident postmortem.
Advantages
- firstly, Supports both metrics and logs
- subsequently, Supports parameters enabling interactive reports where selecting an element in a table will dynamically update associated charts and visualizations.
Limitations
- firstly, No automatic refresh.
- then, No dense layout like dashboards, which make workbooks less useful as a single pane of glass. Intended more for providing deeper insights.
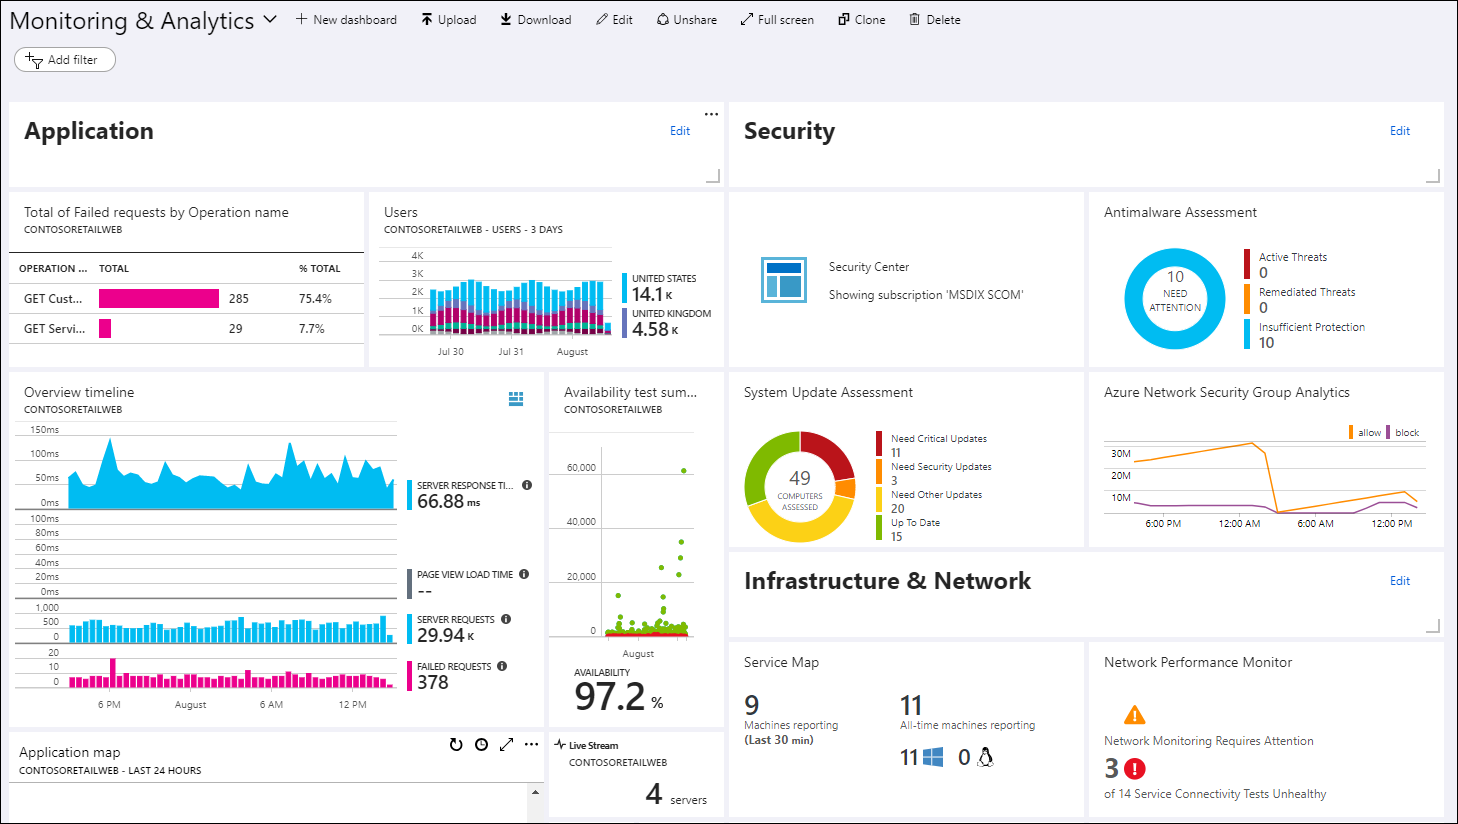
What are Azure Dashboards?
Azure dashboards are the primary dashboarding technology for Azure. They’re mainly useful in providing single pane of glass over your Azure infrastructure and also services allowing you to quickly identify important issues.
Advantages
- Deep integration into Azure. Visualizations can be pinned to dashboards from multiple Azure pages including Metrics Explorer, Log Analytics, and Application Insights.
- further, Supports both metrics and logs.
Limitations
- Limited control over log visualizations with no support for data tables. Total number of data series is limited to 10 with further data series grouped under an other bucket.
- also, No custom parameters support for log charts.
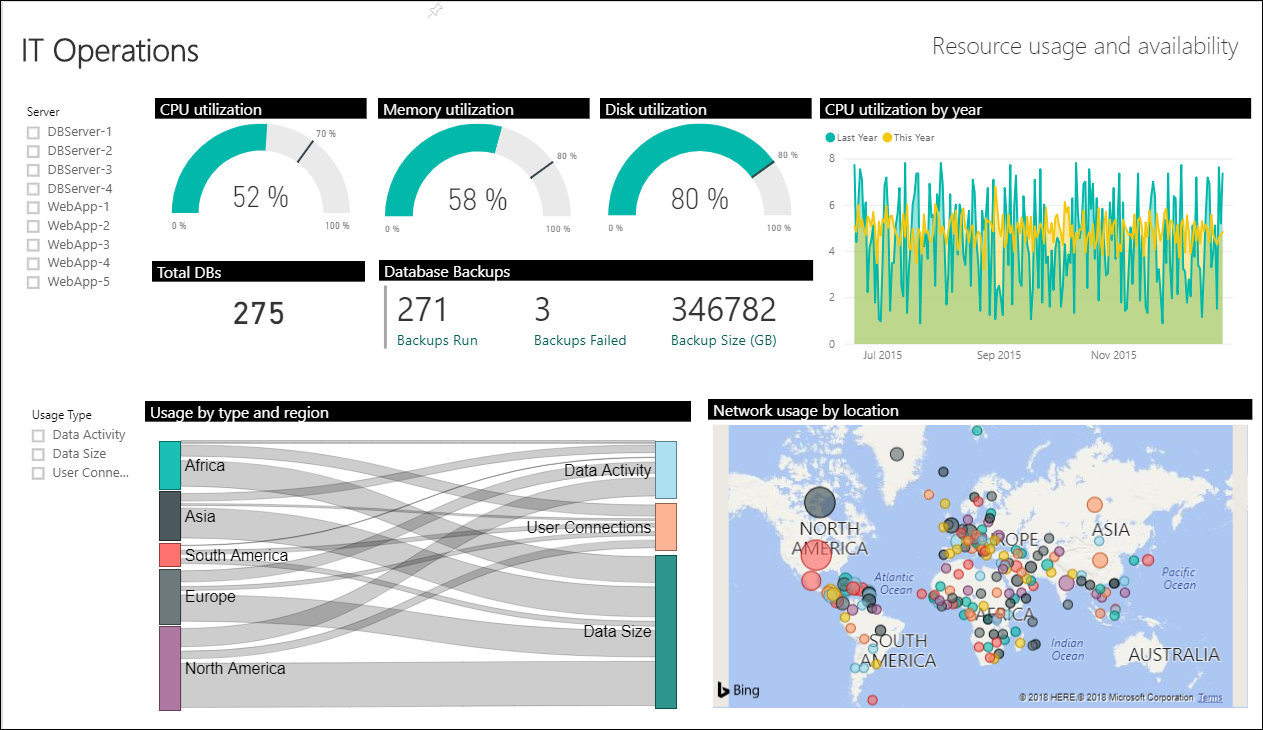
What is Power BI?
Power BI is particularly useful for creating business-centric dashboards and reports, as well as reports analyzing long-term KPI trends. You can import the results of a log query into a Power BI dataset so you can take advantage of its features such as combining data from different sources and sharing reports on the web and mobile devices.
Advantages
- Rich visualizations.
- also, Extensive interactivity including zoom-in and cross-filtering.
Limitations
- Supports logs but not metrics.
- Then, No Azure integration. Can’t manage dashboards and models through Azure Resource Manager.
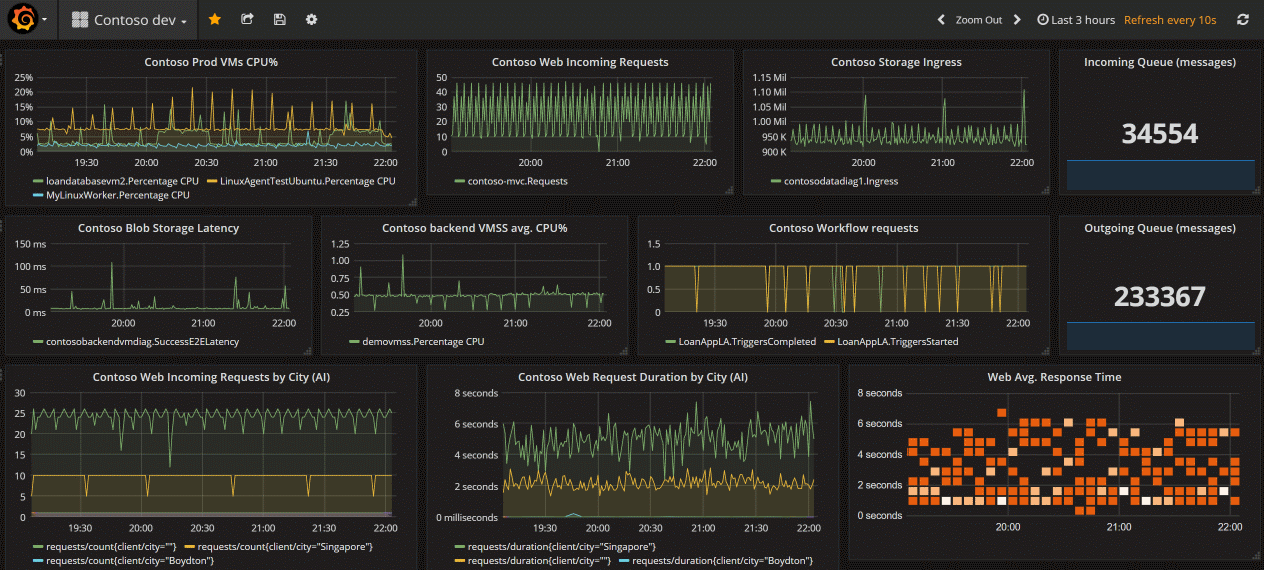
Explaining Grafana
Grafana is an open platform that excels in operational dashboards. It’s mainly useful for detecting and isolating and triaging operational incidents. You can add Grafana Azure Monitor data source plugin to your Azure subscription to have it visualize your Azure metrics data.
Advantages
- firstly, Rich visualizations.
- furthermore, Rich ecosystem of data sources.
Limitations
- No Azure integration. Can’t manage dashboards and models through Azure Resource Manager.
- then, Cost to support additional Grafana infrastructure or additional cost for Grafana Cloud.
Building your own custom application
You can build your own custom application including the features you wish for. You can access data in log and metric data in Azure Monitor through their API using any REST client, which allows you to build your own custom websites and applications.
Advantages
- Complete flexibility in UI, visualization, interactivity, and features.
- also, Combine metrics and log data with other data sources.
Disadvantages
- Significant engineering effort required.
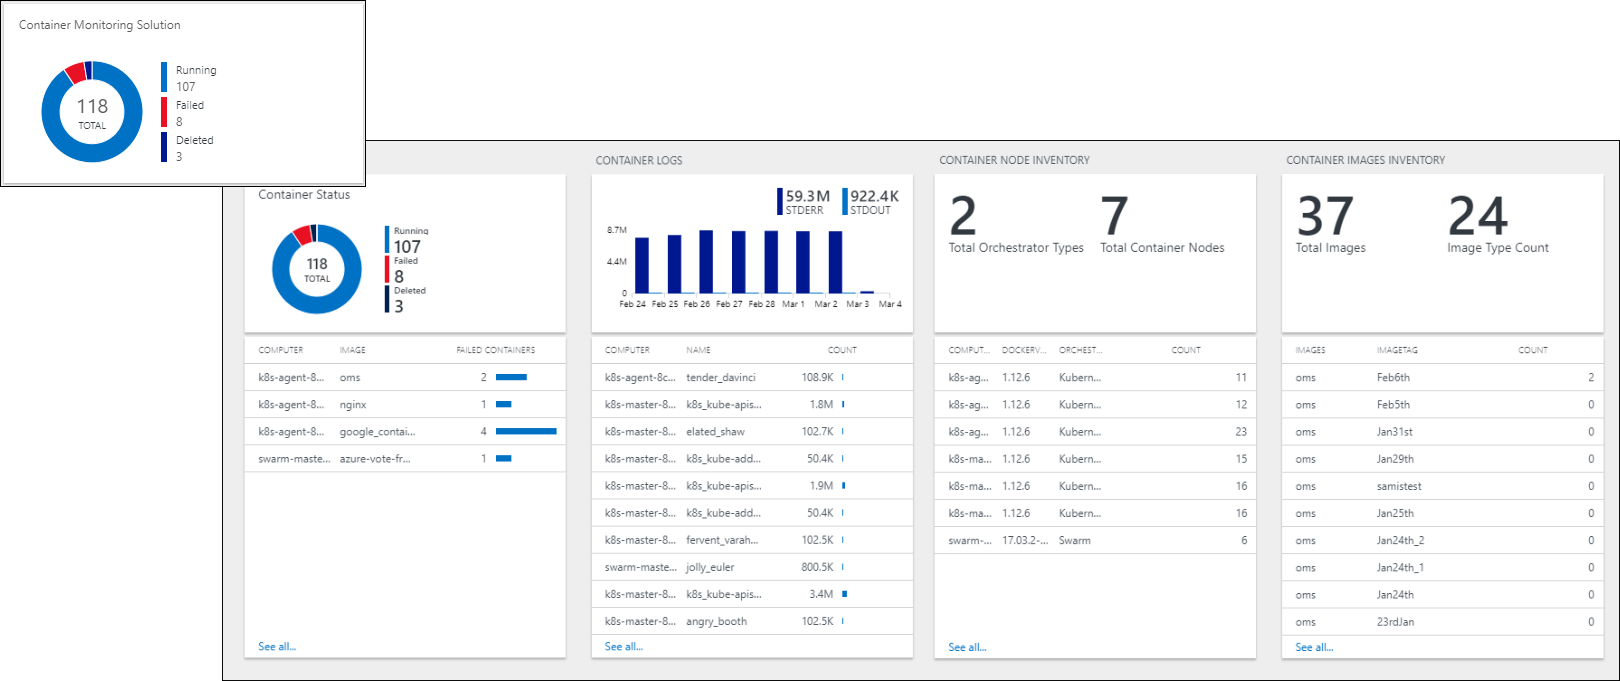
Using Azure Monitor Views
Views in Azure Monitor allow you to create custom visualizations with log data. They are used by monitoring solutions to present the data they collect.
Advantages
- firstly, Rich visualizations for log data.
- secondly, Export and import views to transfer them to other resource groups and subscriptions.
Limitations
- Supports logs but not metrics.
- subsequently, No personal views. Available to all users with access to the workspace.
Reference documentation – Visualizing data from Azure Monitor