Exam 70-779: Analyzing and Visualizing Data with MS Excel
The Analyzing and Visualizing Data with MS Excel (70-779) Exam will enhance your efficiency in MS Excel visualizations and data analysis. This Microsoft certification showcases your critical thinking and decision making approach at the MCSA level. Most importantly, taking this certification exam will expose you to explore real-world mastery in Microsoft Excel. This certification will give you a professional edge over your peers and help gain financial benefits as well.
Who Should Take the Analyzing and Visualizing Data with MS Excel Exam?
Candidates seeking to take the Analyzing and Visualizing Data with MS Excel Exam must possess a strong understanding of the application of Microsoft Excel in performing data analysis, and visualization. You must ace in your practical and conceptual abilities in consuming, transforming, modeling, and visualizing the given data in Excel. Moreover, Microsoft recommends candidates to gain command of the configuration and manipulation of data in PowerPivot, PivotTables, and PivotCharts. The Analyzing and Visualizing Data with MS Excel Exam is primarily for enhancing the skills of professionals like BI professionals, data analysts, and others involved in analyzing data with MS Excel.
Schedule Your Exam
Follow the steps below to schedule your Microsoft certification exam –
- Go to the Microsoft portal, to register yourself
- Click on “Schedule Exam” to schedule an exam date at your convenience
- Fill all your details asked in the next page that appears
- Select the exam delivery option on the Pearson VUE page
- Pay your exam fees. You have successfully registered for the MS 70-779 Exam
Exam Result
Right after successfully completing your exam, you will be notified of your pass or fail status within a few minutes of
completing your exam. Also, printed reports providing your exam score and feedback on your performance will also be provided to you. Your score will be forwarded to Microsoft within five business days.
As far as Beta exam results are concerned, your result will be visible on your Microsoft transcript. However, you will see your result only if you’ve achieved a passing score. Also, this result will be published on Pearson VUE’s site within 14 business days, after the live exam is published.
Note – If you are able to clear the beta exam, you will earn Microsoft credit for that exam and will also receive a resulting certification. Moreover, you are not required to retake the exam in its live version after clearing its beta version.

Exam Retake Policy
If anyhow you are not able to achieve a passing score in the Microsoft 70-779 exam. However, you will have to wait for a minimum of 24 hours before you become eligible for a retake. Failure in the second attempt will result in a waiting time of 14 days before rescheduling your third attempt. The waiting period for the fourth and the fifth attempts will also be 14 days. All candidates are allowed a maximum of five attempts per year.
Exam Cancellation Policy
Microsoft offers candidates to cancel or reschedule their exams within a minimum of 24 hours prior to the exam date. However, to prevent any cancellation fee, you must cancel or reschedule your exam, at least 6 business days prior to the date scheduled for your exam. Also, if you fail to appear in the exam, then you will not receive any refund of the exam fee.
For More Exam Details – Analyzing and Visualizing Data with MS Excel FAQs
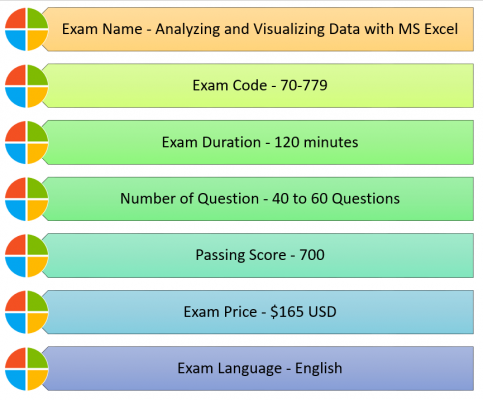
Exam Details
Course Outline – MS 70-779 Exam
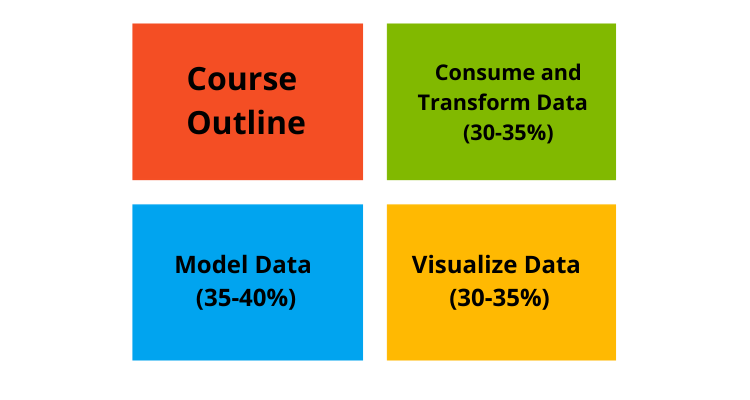
Topic 1: Consume and Transform Data by Using Microsoft Excel (30-35%)
1.1 Import from data sources
- connect to and import from databases, files, and folders (Microsoft Documentation: Import data from external data sources (Power Query))
- connect to Microsoft SQL Azure, Big Data, SQL Server Analysis Services (SSAS), and Power Query (Microsoft Documentation: Data sources supported in SQL Server Analysis Services, DirectQuery mode in tabular models, Azure Analysis Services)
- import supported file types
- import from other Excel workbooks (Microsoft Documentation: Import or link to data in an Excel workbook)
- link to data from other sources (Microsoft Documentation: Import or link to data in another Access database)
1.2 Perform data transformations
- design and implement basic and advanced transformations, apply business rules, change data format to support visualization, filter data, format data
1.3 Cleanse data
- manage incomplete data; handle data received as a report
- remove unnecessary rows, columns, and data (Microsoft Documentation: Data reduction techniques for Import modeling)
- remove repeating headers
Topic 2: Model Data (35-40%)
2.1 Create and optimize data models
- manage data relationships, optimize models for reporting, manually enter data, perform Get & Transform, create automatic relationships, create manual relationships (Microsoft Documentation: Create and manage relationships in Power BI Desktop)
2.2 Create calculated columns, measures, and tables
- create DAX queries, create DAX formulas, create Excel formulas (Microsoft Documentation: Create calculated tables in Power BI Desktop, Create calculated columns in Power BI Desktop, Create your own measures)
2.3 Create performance KPIs
- calculate the actual value, calculate the target value, calculate actual to target values (Microsoft Documentation: Create key performance indicator (KPI) visualizations)
2.4 Create hierarchies
- create date hierarchies, create business hierarchies, resolve hierarchy issues (Microsoft Documentation: Create and manage hierarchies)
Topic 3: Visualize Data (30-35%)
3.1 Create and manage PivotTables
- format PivotTables and PivotCharts, format calculated measures, filter data, group and summarize data (Microsoft Documentation: Create a PivotTable to analyze worksheet data, Measures in Power Pivot)
3.2 Create and manage PivotCharts
- select a chart type, format calculated measures, filter data; group and summarize data, use slicers (Microsoft Documentation: Create a PivotChart, Use slicers to filter data)
3.3 Interact with Power BI
- import Excel data from Power BI, manipulate Excel data in Power BI (Microsoft Documentation: Change how visuals interact in a Power BI report, Import Excel workbooks into Power BI Desktop)
Preparation Guide For The Analyzing and Visualizing Data with MS Excel (70-779) Exam
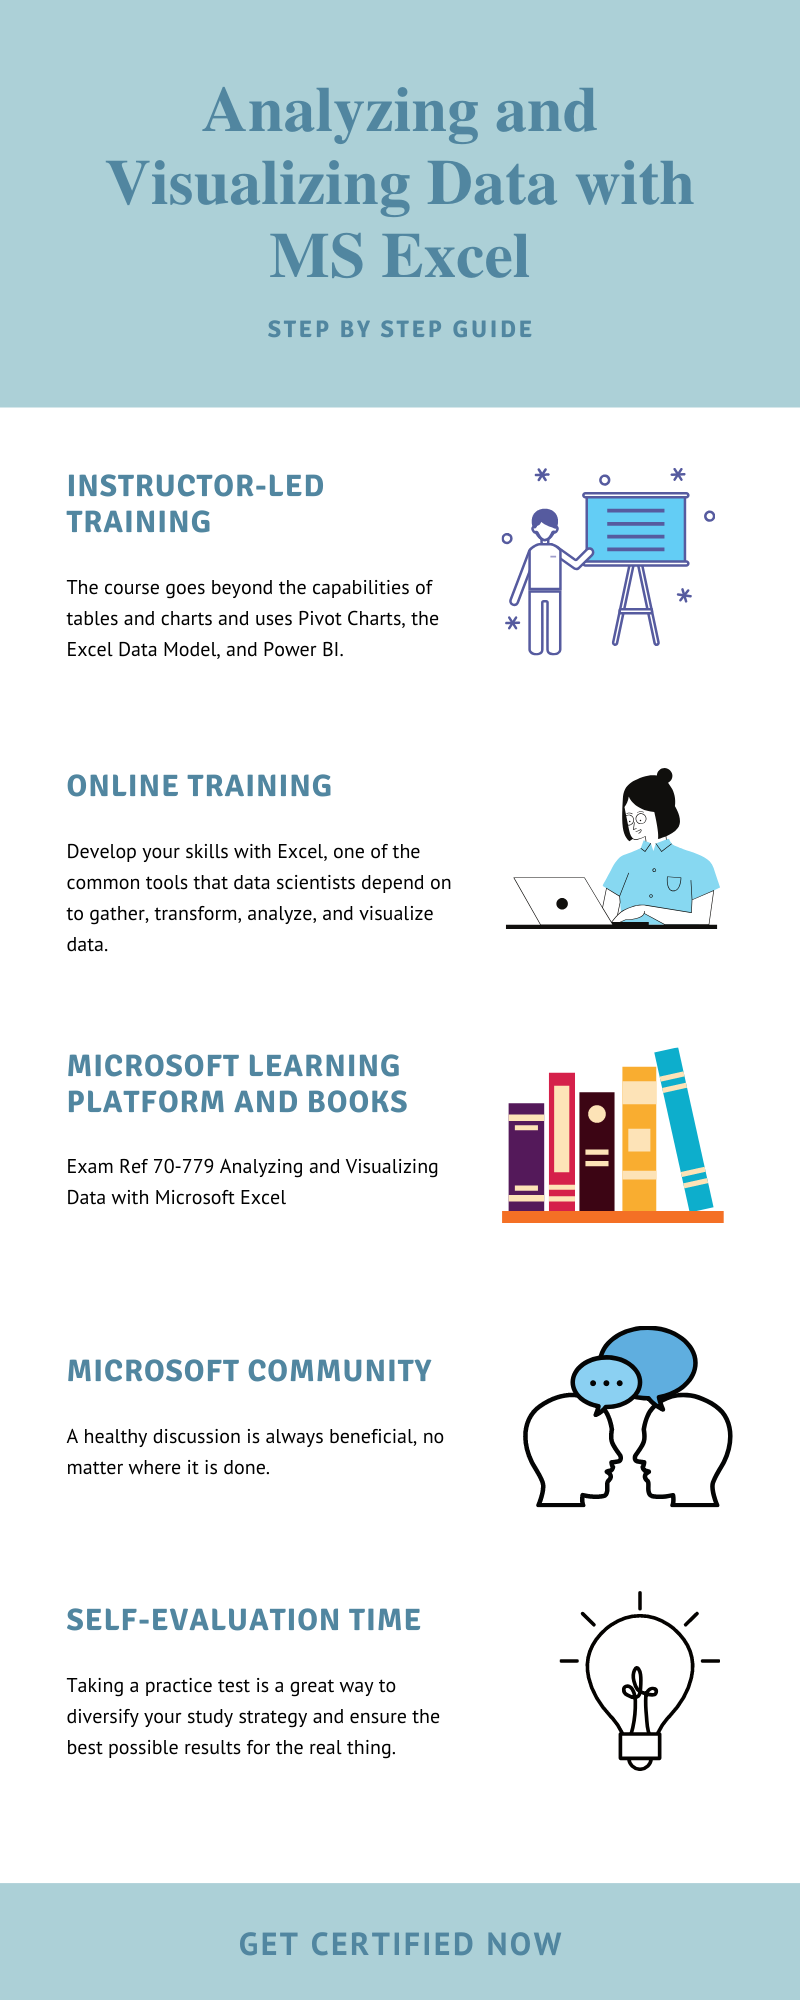
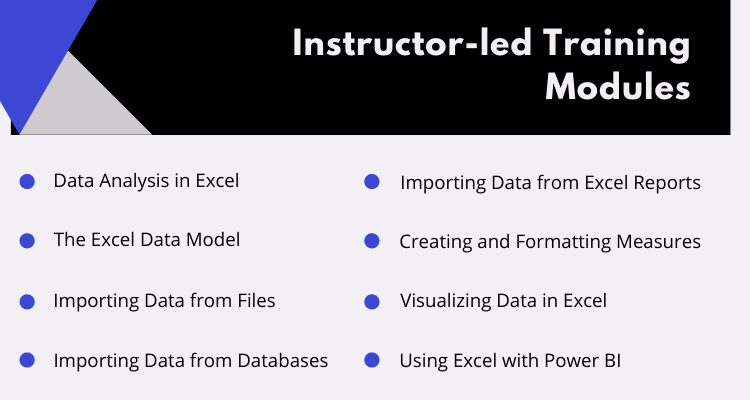
Instructor-led Training
Course 20779-B: Analyzing Data with Excel
Microsoft has designed the 3-day Advanced 20779-B: Analyzing Data with Excel course, with the help of subject matter experts, for the candidates seeking to take the Analyzing and Visualizing Data with MS Excel (70-779) Exam. The course is specifically framed to give candidates, the ability to apply the BI techniques to Excel data analysis. The scope of this course is to train the candidates in fields beyond the capabilities of tables and charts. It aims to enhance your proficiency in the application of Pivot Charts, Excel Data Model, and Power BI. This course is primarily for experienced Data analysts in Excel, to gain expertise in the BI techniques. The course is ideal for the SQL Server report creators, as it helps them gain knowledge of other alternative methods of presenting data.
Skills Acquired
- Explore and extend a classic Excel dashboard.
- Explore and extend an Excel data model.
- Pre-format and import a .CSV file.
- Import data from a SQL Server database
- Import data from a report.
- Create measures using advanced DAX functions.
- Create data visualizations in Excel.
- Create a Power BI dashboard with Excel.
Microsoft Learning Platform
Microsoft publishes every minute update and details related to the Microsoft 70-779 exam, on its Learning Platform. Hers, you can get all the exam related information varying from the exam pattern, and types of questions, to the content outline, and exam objectives. The Microsoft Learning Platform will also provide you with the Exam Skills Outline for the reference of the candidates taking the Analyzing and Visualizing Data with MS Excel (70-779) Exam.
Online Training
Microsoft offers the Analyzing and Visualizing Data with Excel online training to enable candidates to gain insight into the pattern of questions asked. Upon completing the training, you’ll gain command in the following skills –
- Gather and transform data from multiple sources
- Discover and combine data in mashups
- Learn about data model creation
- Explore, analyze, and visualize data
Reference Books
Microsoft provides reference books that can be helpful while studying for the exam. This book contains various useful resources that can be used while studying. See the Microsoft recommended Exam book for Analyzing and Visualizing Data with Microsoft Excel, to get a deeper insight into the exam objectives, and hence crack the test, and earn your certification.
![Best [EBOOK] Exam Ref 70-779 Analyzing and Visualizing Data with Micr…](https://image.slidesharecdn.com/bestebookexamref70779-180809144807/95/best-ebook-exam-ref-70779-analyzing-and-visualizing-data-with-microsoft-excel-pdf-books-1-638.jpg?cb=1533826104)
Join the Microsoft Community/ Online Forum
A healthy discussion is always beneficial, no matter where it is done. The same goes for online discussion forums. This is a nice way for the students to discuss their issues and get insights into how their competitors are going for the exams. One thing which is an advantage for anything that comes online is the scope of people joining it. An offline discussion is restricted to a small number of people, whereas online platforms can reach a wider range.
The prospects of getting resolutions to an issue increase steeply when a greater number of people are involved. Also, multiple viewpoints make the stuff more dynamic. These discussions make the studies more comprehensive. Introverts get a chance to express themselves, who might otherwise prefer staying out of discussions. Forums work really well to build a community that is essential for understanding others.
Self-evaluation Time – Practice Exam
Regardless of how you prepare for the Analyzing and Visualizing Data with MS Excel Exam, a practice run or two can help you in more ways than you might expect. Taking a practice test is a great way to diversify your study strategy and ensure the best possible results for the real thing. Analyzing your answers will help you identify the areas where you need to give special attention to, and will also let you know your alignment with the exam objectives.