Describe the Power BI Desktop Reports, Data, and Model tabs
The Power BI Desktop Reports, Data, and Model tabs will be discussed. Prepare to learn about:
- Report view
- Power BI Desktop’s Work with Data view,
- Power BI Desktop’s Work with Modeling view.
Report view in Power BI Desktop
- Firstly, Power BI Desktop has a Report view, where we can create any number of report pages with visualizations.
- Secondly, the report view in Power BI Desktop provides a similar design experience to the report’s editing view in the Power BI service.
- Also, we can move visualizations around, copy and paste, merge, and more.
- Now, the difference between them is when using Power BI Desktop, we can work with our queries and model your data to make sure the data supports the best insights in your reports.
- Lastly, we can then save your Power BI Desktop file wherever you like, whether it’s your local drive or to the cloud.
Work with Data view in Power BI Desktop
In the Power BI Desktop model, the data view allows you to inspect, study, and interpret data. Clearly, it differs from the way tables, columns, and data are displayed in Power Query Editor. You’re also looking at your data after it’s been loaded into the model with Data view.
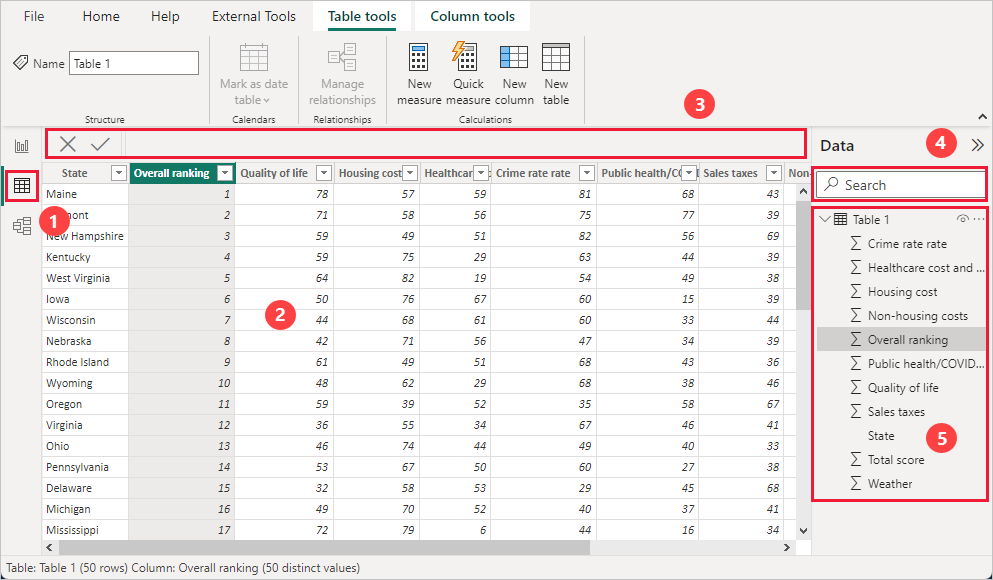
- Firstly, when we are modeling our data, sometimes you want to see what’s actually in a table or column without creating a visual on the report canvas.
- Next, we might want to see right down to the row level.
- Also, this ability is useful when we are creating measures and calculated columns, or need to identify a data type or data category.
Work with Modeling view in Power BI Desktop
You can see and work with complex datasets with multiple tables in Power BI Desktop’s Modeling view.
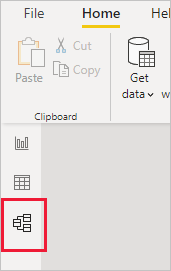
- In order to to access Modeling view, you must select the Modeling view icon found on the left side of Power BI Desktop.
- Now, with Modeling view, we can create diagrams of your model that contain only a subset of the tables in your model.
- Next, drag a table from the Fields list onto the diagram surface. Right click the table, and then select Add related tables from the menu that appears.
- Then, we can select multiple objects at once in Modeling view by holding down the CTRL key and clicking multiple tables.
- Thereafter, When you select multiple tables they become highlighted in Modeling view.
- Lastly, when multiple tables are highlighted, changes applied in the Properties pane apply to all selected tables.