Analyzing Data using Power BI
In this module, we will be understanding the process to view and explore content as well as learn to interact and work with reports and dashboards. This will not only help you to uncover as well as share new business insights. Since data is the key to Power BI, we will examine reports with visual draws containing data from sources with far more data than required. We shall now learn how filters are applied to the data.
How to Filter Data using Power BI?
Power BI provides various ways of filtering and highlighting reports. Therefore it becomes important to know the process to filter data for finding the appropriate information. When we are filtering a visual like a bar chart, then we are only altering the view of the data and not modifying the source of the data. Such that Filtering only applies to reports, not to dashboards.
Slicers – Slicer is the first type of filtering which can be used directly on the report page. They offer cues to ways you can filter the results in the visuals on a report page. Types of slicers – Numeric, Categorical, and Date. The primary benefit of slicers is that it makes it simpler to filter all the visuals on the page at once.
Filter Panes – The second method used to filter data is by opening and modifying filters in the Filters pane. Such that the filter panes contain filters added to the report by the report designer. The four types of filters are –
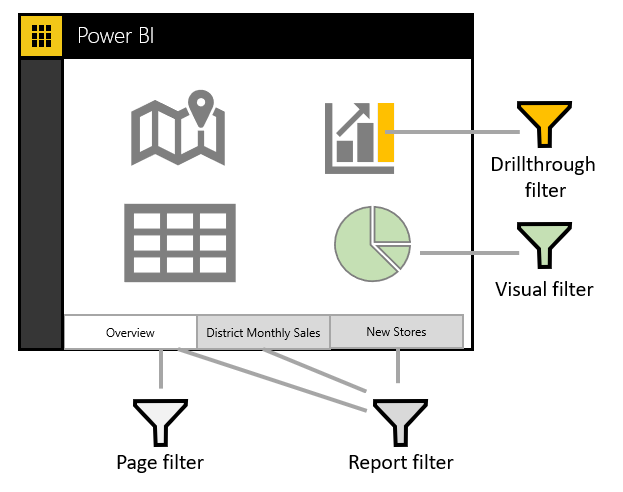
- Report – They are applied to all pages in the report.
- Page – They are applied to all the visuals on the current report page.
- Visual – They are applied to a single visual on a report page. The visual level filters can only be seen when we select a visual on the report canvas.
- Drillthrough – They permit you to explore successively more detailed views within a single visual.
Points to Remember
- We can apply filters on the Filters pane, or select data directly in the report to narrow by date, category, or location and more.
- We can explore data by modifying the existing filter.
- Changes made are saved for you and not for others with the report
- Filters are saved when you exit the report
- Select Reset to default from the top menu bar to undo your filtering and return to the default filtering.
How to Clear a Filter?
We can either use the advanced or basic filtering mode and then select the eraser icon to clear the filter. As we adjust the filter, the search query updates to reflect our choices. At times we may need to apply a filter based on a dynamic range for filtering between dates or certain number values.
Steps to sort Charts in a Report
In a Power BI report, we can sort most visuals alphabetically or by numeric values of each category. It is simple to change the sort from a category (like name) to a value (like sales). But note not all visuals can be sorted. The Power BI reports always restore the filters, slicers, sorting, and other data view changes being made. So whenever we leave a report and then return later, those changes are saved. But in case you wish to revert the changes to the report designer’s settings, then select Reset to default from the top menu bar.
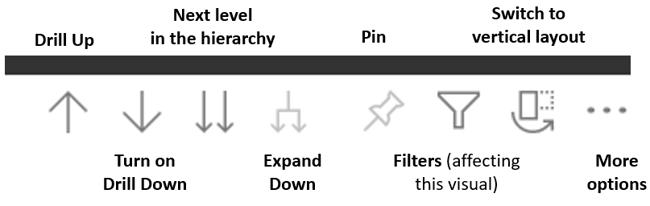
How to Drill down in a Visual?
At times when a visual has a hierarchy, then we can drill down to reveal additional details.
Creating and using Bookmarks
We create report bookmarks to share certain filtered views with our team. Since the use of bookmarks in Power BI not only helps in capturing the currently configured view of a report page, as well as include filtering and the state of visuals. We can also return later to that state by selecting the saved bookmark. We will be able to create a maximum of 20 bookmarks per report.
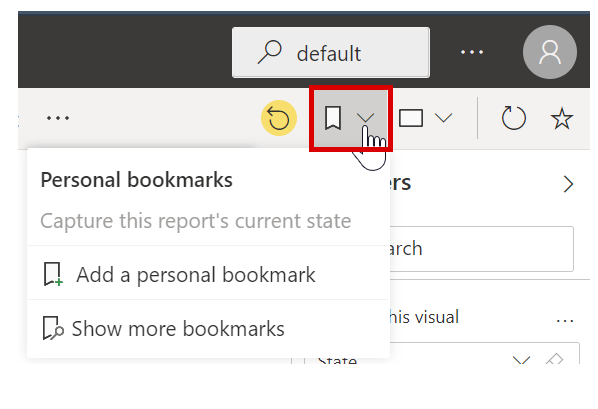
We shall now discuss the steps to create bookmark
1. Firstly select the report and view that we like, then expand the Bookmarks drop-down menu and select Add personal bookmark.
2. Secondly, by default, Power BI will suggest a generic name for the bookmark.
3. Thirdly, we can type in our own name and select Save.
4. Lastly, after creating a bookmark, we can display it by selecting the bookmark name in the drop-down list.