Using Azure Monitor for VMs
Exam AZ-303 is retired. AZ-305 replacement is available.
We will be learning How to chart performance with Azure Monitor for VMs. Azure Monitor for VMs includes a set of performance charts that target several key performance indicators (KPIs) to help you determine how well a virtual machine is performing. Through this tutorial you will learn to identify bottlenecks, anomalies, or switch to a perspective listing each machine to view resource utilization based on the metric selected.
What are the Limitations?
Following are limitations in performance collection with Azure Monitor for VMs.
- Available memory is not available for virtual machines running Red Hat Linux (RHEL) 6. This metric is calculated from MemAvailable which was introduced in kernel version 3.14.
- Metrics are only available for data disks on Linux virtual machines using EXT filesystem family (EXT2, EXT3, EXT4).
What is Multi-VM perspective from Azure Monitor?
From Azure Monitor, the Performance feature provides a view of all monitored VMs deployed across workgroups in your subscriptions or in your environment. To access from Azure Monitor, perform the following steps.
- In the Azure portal, select Monitor.
- Then, Choose Virtual Machines in the Solutions section.
- After that, Select the Performance tab.
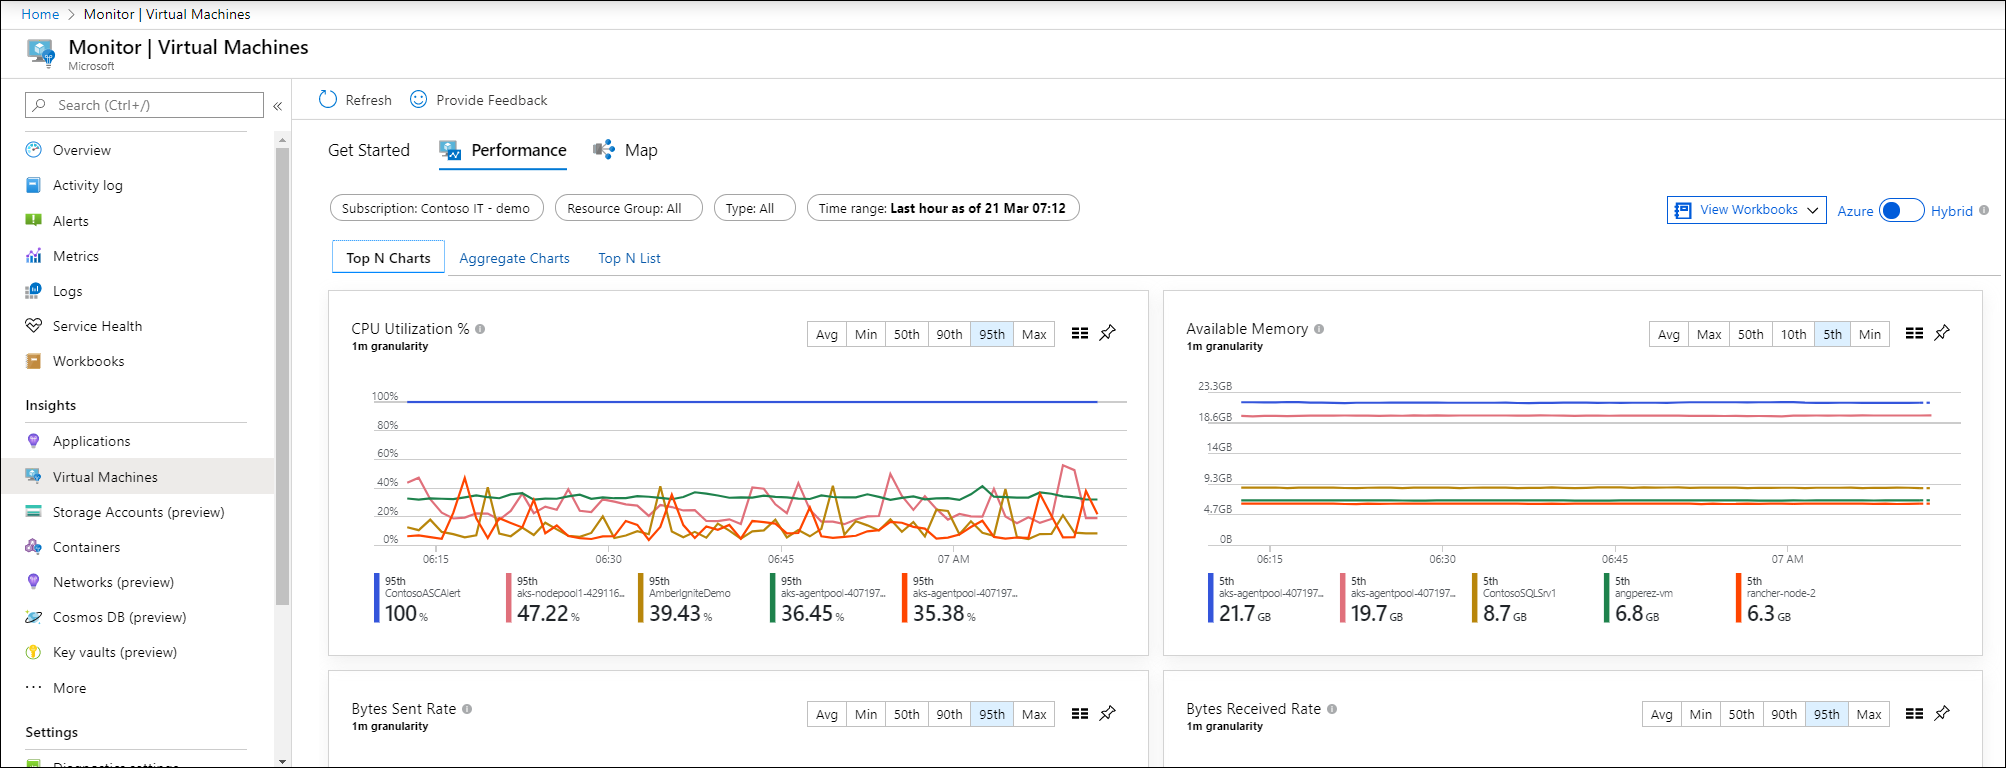
Now, On the Top N Charts tab, if you have more than one Log Analytics workspace, choose the workspace enabled with the solution from the Workspace selector at the top of the page.
- Group Selector – The Group selector will return subscriptions, resource groups, computer groups, and virtual machine scale sets of computers related to the selected workspace that you can use to further filter results presented in the charts on this page and across the other pages.
- TimeRange Selector – You will find that By default, the charts show the last 24 hours. Using the TimeRange selector, you can query for historical time ranges of up to 30 days to show how performance looked in the past.
Properties
Clicking on the pin icon at the upper right-hand corner of any one of the charts will pin the selected chart to the last Azure dashboard you last viewed. From the dashboard, you can resize and reposition the chart.
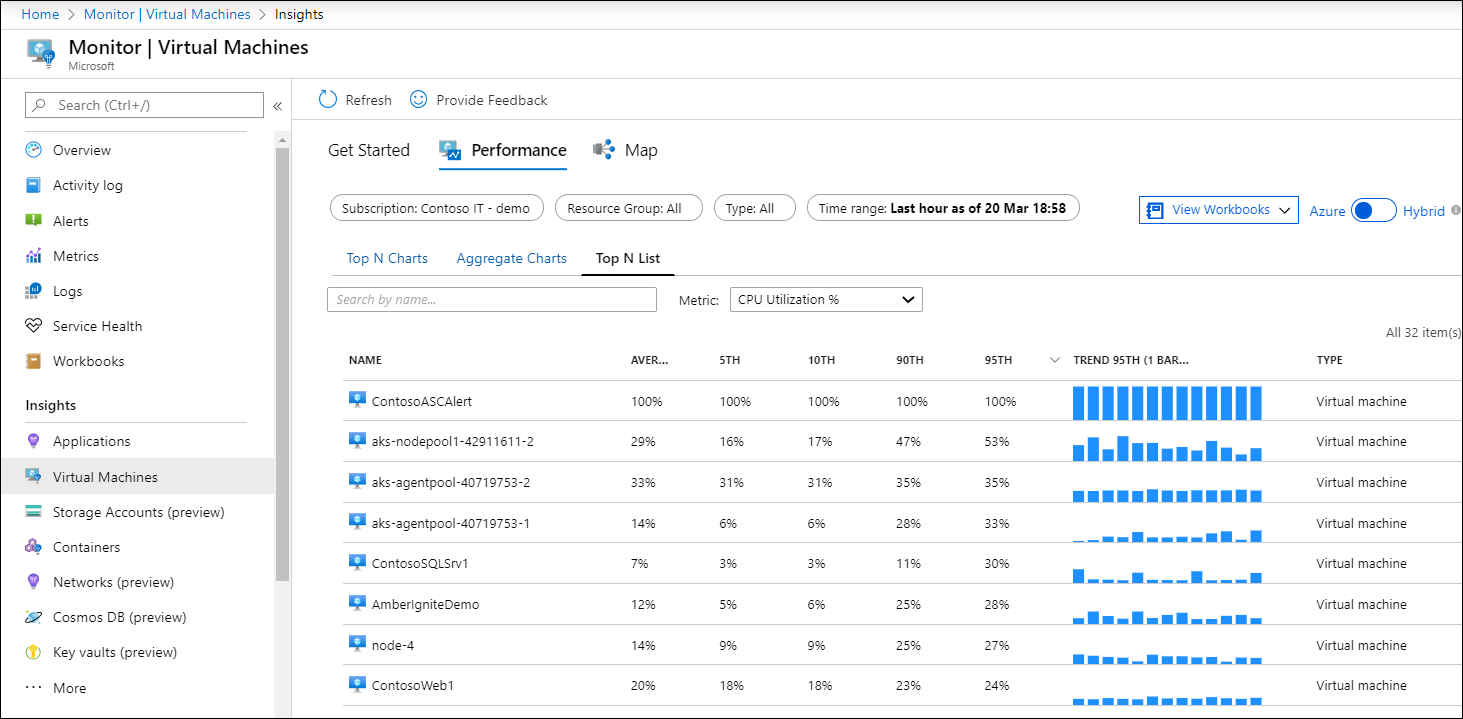
Clicking on the icon located to the left of the pin icon on any one of the five charts opens the Top N List view. Here you see the resource utilization for that performance metric by individual VM in a list view and which machine is trending highest.
When you click on the virtual machine, the Properties pane is expanded on the right to show the properties of the item selected, such as system information reported by the operating system, properties of the Azure VM, etc. Clicking on one of the options under the Quick Links section will redirect you to that feature directly from the selected VM. Switch to the Aggregated Charts tab to view the performance metrics filtered by average or percentiles measures.
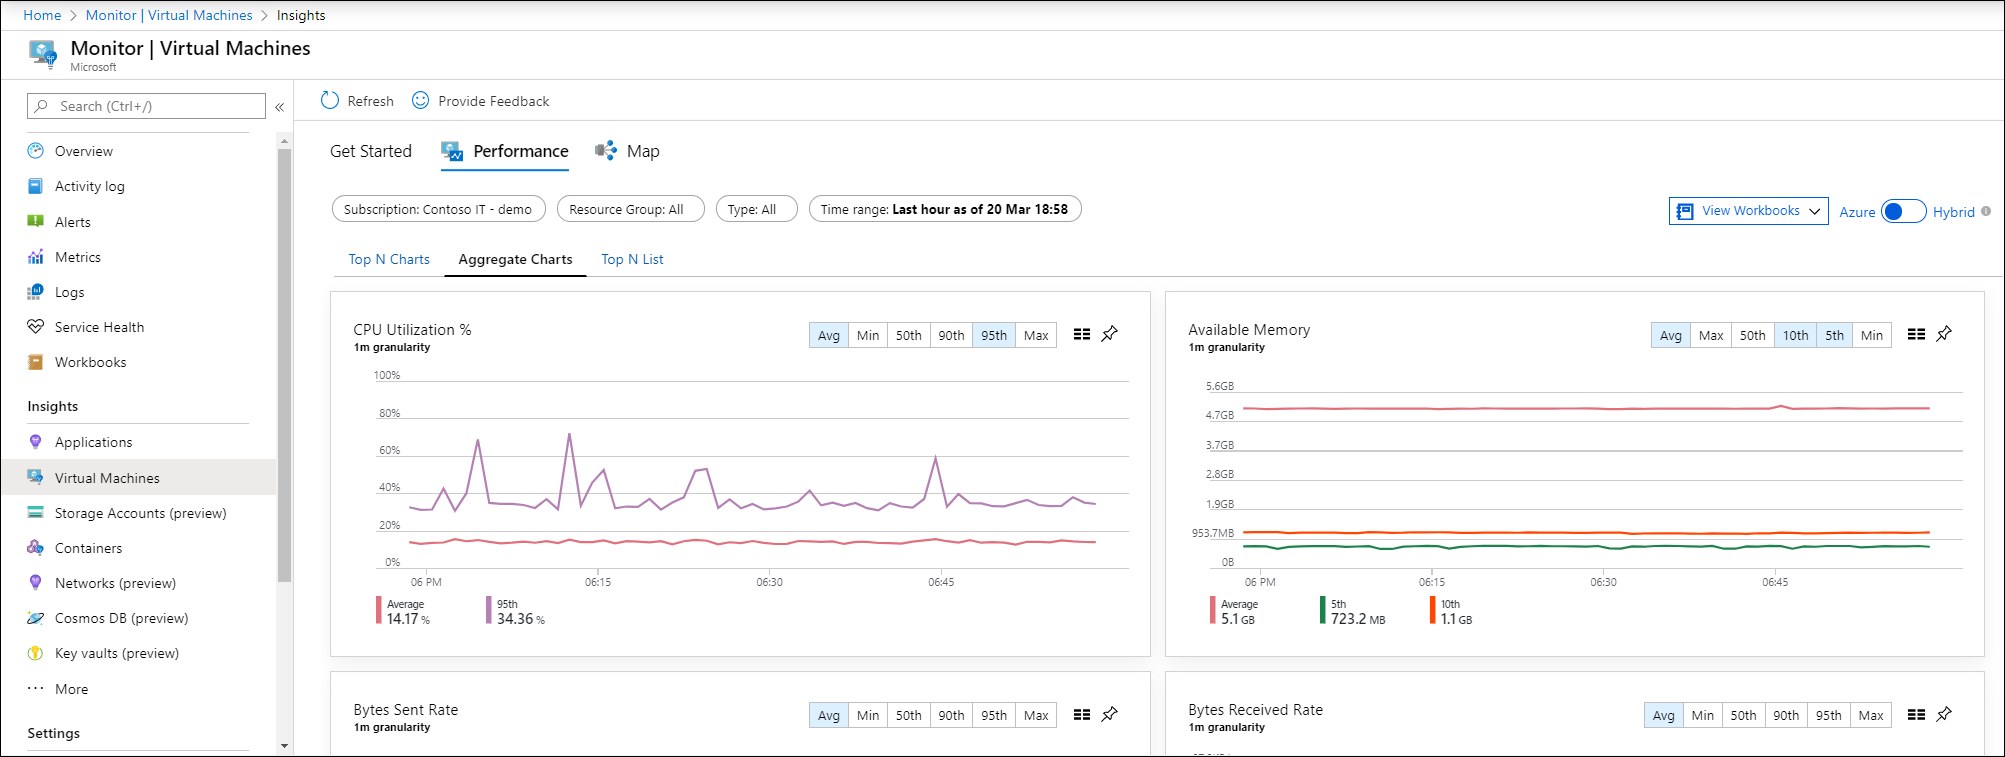
You can also change the granularity of the charts within the time range by selecting Avg, Min, Max, 50th, 90th, and 95th in the percentile selector.
To view the resource utilization by individual VM in a list view and see which machine is trending with highest utilization, select the Top N List tab. The Top N List page shows the top 20 machines sorted by the most utilized by 95th percentile for the metric CPU Utilization %. You can see more machines by selecting Load More, and the results expand to show the top 500 machines.
How to View performance directly from an Azure VM?
To access directly from a virtual machine, perform the following steps.
- In the Azure portal, select Virtual Machines.
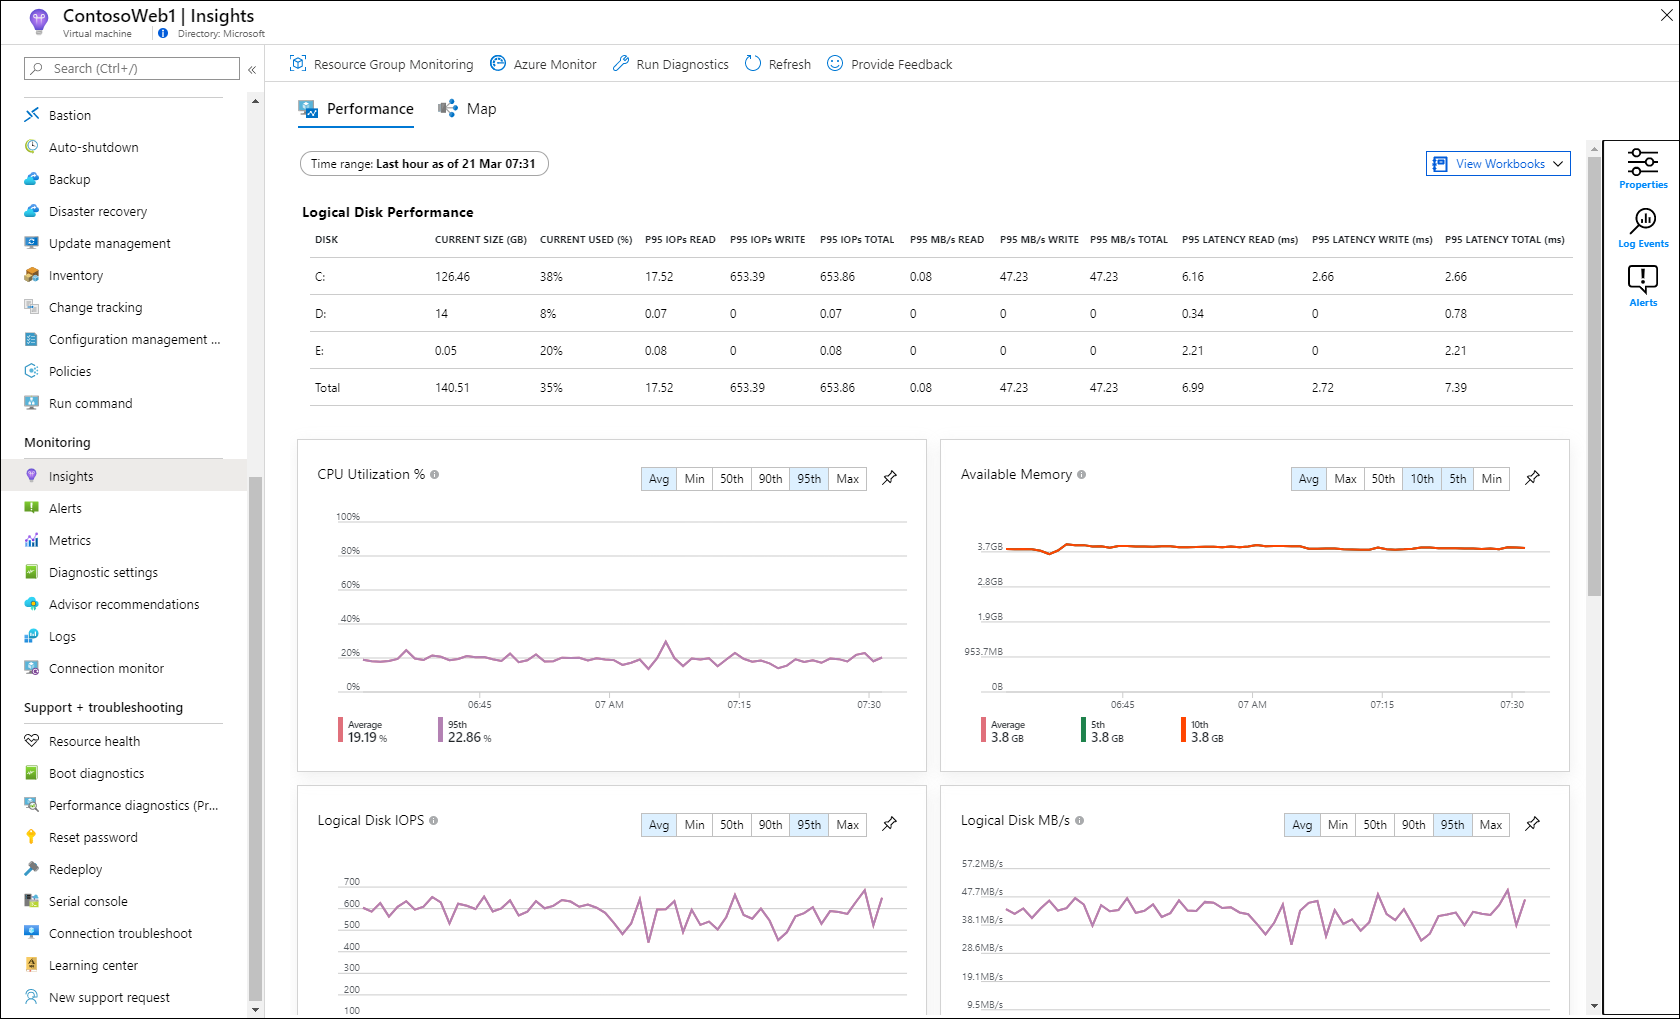
- From the list, choose a VM and in the Monitoring section choose Insights.
- Select the Performance tab.
This page not only includes performance utilization charts, but also a table showing for each logical disk discovered, its capacity, utilization, and total average by each measure.
Clicking on the pin icon at the upper right-hand corner of any one of the charts pins the selected chart to the last Azure dashboard you viewed. From the dashboard, you can resize and reposition the chart. Selecting the chart from the dashboard redirects you to Azure Monitor for VMs and loads the performance detail view for the VM.
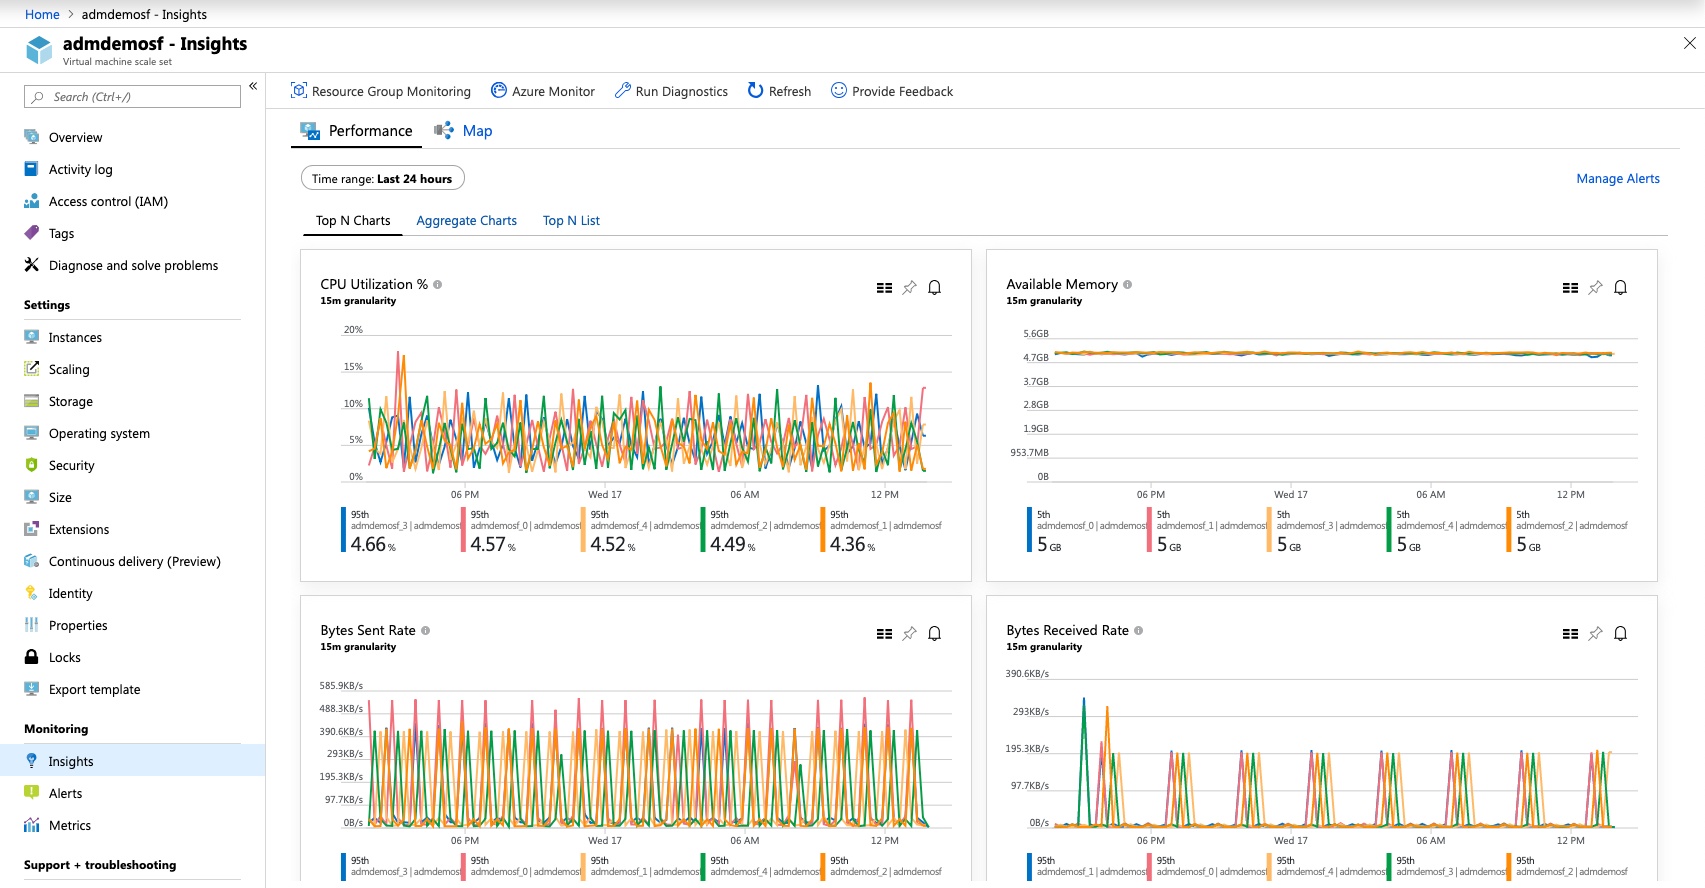
View performance directly from an Azure virtual machine scale set
To access directly from an Azure virtual machine scale set, perform the following steps.
- In the Azure portal, select Virtual machine scale sets.
- From the list, choose a VM and in the Monitoring section choose Insights to view the Performance tab.
This page loads the Azure Monitor performance view, scoped to the selected scale set. This enables you to see the Top N Instances in the scale set across the set of monitored metrics, view the aggregate performance across the scale set, and see the trends for selected metrics across the individual instances n the scale set.
Clicking on the pin icon at the upper right-hand corner of any one of the charts pins the selected chart to the last Azure dashboard you viewed. From the dashboard, you can resize and reposition the chart. Selecting the chart from the dashboard redirects you to Azure Monitor for VMs and loads the performance detail view for the VM.