Monitor workload – Azure portal
In this we will describes how to use the Azure portal to monitor your workload. This includes setting up Azure Monitor Logs to investigate query execution and workload trends using log analytics for Synapse SQL.
Create a Log Analytics workspace
Navigate to the browse blade for Log Analytics workspaces and create a workspace
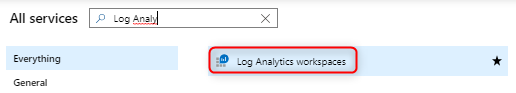
- Firstly, in the Azure portal, click All services. In the list of resources, type Log Analytics. As you begin typing, the list filters based on your input. Select Log Analytics workspaces.
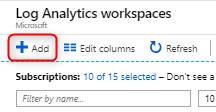
- Secondly, click Add, and then select choices for the following items:
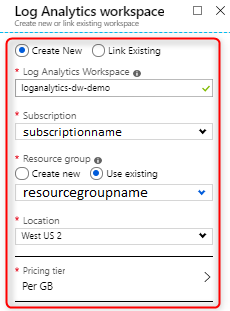
- First, provide a name for the new Log Analytics workspace, such as DefaultLAWorkspace. This name must be globally unique across all Azure Monitor subscriptions.
- Then, select a Subscription to link to by selecting from the drop-down list if the default selected is not appropriate.
- Next, for Resource Group, choose to use an existing resource group already setup or create a new one.
- After that, select an available Location. For more information, see which regions Log Analytics is available in and search for Azure Monitor from the Search for a product field.
- Then ,create Log Analytics resource blade
- Lastly, after providing the required information on the Log Analytics Workspace pane, click OK.
Turn on Resource logs
Configure diagnostic settings to emit logs from your SQL pool. Logs consist of telemetry views equivalent to the most commonly used performance troubleshooting DMVs. Currently the following views are supported:
- Firstly, sys.dm_pdw_exec_requests
- Secondly, sys.dm_pdw_request_steps
- Thirdly, sys.dm_pdw_dms_workers
- Then, sys.dm_pdw_waits
- Lastly, sys.dm_pdw_sql_requests
However, Logs can be emitted to Azure Storage, Stream Analytics, or Log Analytics.
Run queries against Log Analytics
Navigate to your Log Analytics workspace where you can do the following:
- Firstly, analyze logs using log queries and save queries for reuse
- Secondly, save queries for reuse
- Thirdly, create log alerts
- Lastly, pin query results to a dashboard
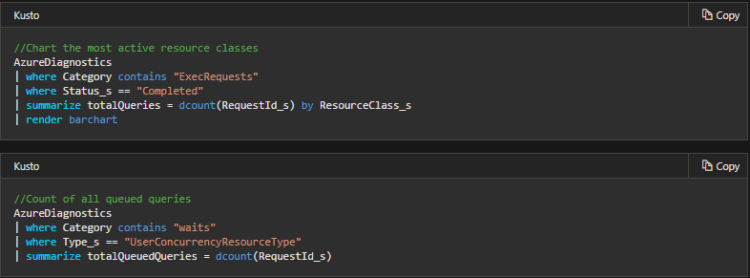
Sample log queries
Kusto
//List all queries
AzureDiagnostics
| where Category contains “ExecRequests”
| project TimeGenerated, StartTime_t, EndTime_t, Status_s, Command_s, ResourceClass_s, duration=datetime_diff(‘millisecond’,EndTime_t, StartTime_t)

Reference: Microsoft Documentation