Monitor a storage account in the Azure portal
Exam DP-200: Implementing an Azure Data Solution EXAM RETIRED ON AUGUST 31, 2021. A replacement exam, DP-203, is available.
Azure Storage Analytics provides metrics for all storage services, and logs for blobs, queues, and tables. Moreover, you can use the Azure portal to configure which metrics and logs are recorded for your account. And, also configure charts that provide visual representations of your metrics data.
Configure monitoring for a storage account
- Firstly, in the Azure portal, select Storage accounts, then the storage account name to open the account dashboard.
- Secondly, select Diagnostics in the MONITORING section of the menu blade.
- Thirdly, select the type of metrics data for each service you wish to monitor, and the retention policy for the data. You can also disable monitoring by setting Status to Off.
However, to set the data retention policy, move the Retention (days) slider or enter the number of days of data to retain, from 1 to 365. The default for new storage accounts is seven days. If you do not want to set a retention policy, enter zero. If there is no retention policy, it is up to you to delete the monitoring data.
- Lastly, when you finish the monitoring configuration, select Save.
Customize metrics charts
Use the following procedure to choose which storage metrics to view in a metrics chart.
- Firstly, start by displaying a storage metric chart in the Azure portal. You can find charts on the storage account blade and in the Metrics blade for an individual service (blob, queue, table, file).
In this example, uses the following chart that appears on the storage account blade:
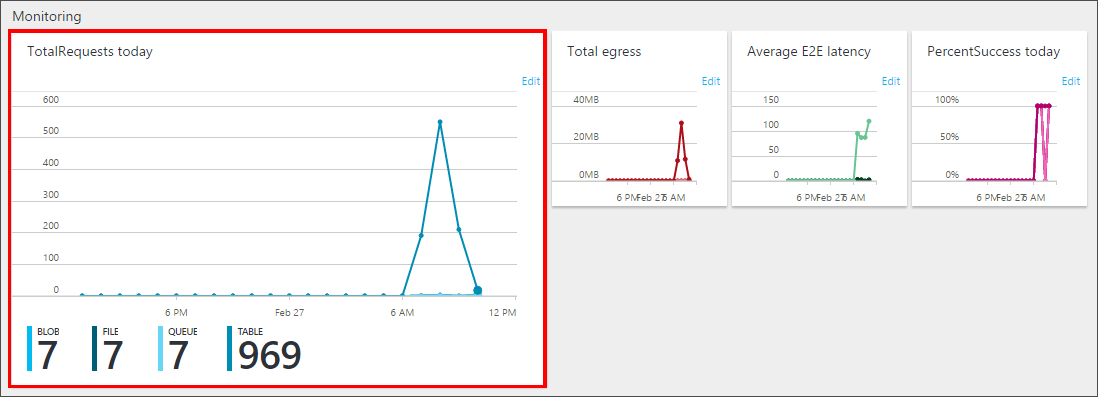
- Secondly, click anywhere within the chart to edit the chart.
- Next, select the Time Range of the metrics to display in the chart, and the service (blob, queue, table, file) whose metrics you wish to display. Here, the past week’s metrics are selected to display for the blob service:
- Lastly, select the individual metrics you’d like displayed in the chart, then click OK.
Metrics resolution
The metrics you selected in Diagnostics determines the resolution of the metrics that are available for your account:
- Firstly, aggregate monitoring provides metrics such as ingress/egress, availability, latency, and success percentages. These metrics are aggregated from the blob, table, file, and queue services.
- Secondly, per API provides finer resolution, with metrics available for individual storage operations, in addition to the service-level aggregates.
Configure metrics alerts
You can create alerts to notify you when thresholds have been reached for storage resource metrics.
- Firstly, to open the Alert rules blade, scroll down to the MONITORING section of the Menu blade and select Alerts (classic).
- Secondly, select Add metric alert (classic) to open the Add an alert rule blade
- Thirdly, enter a Name and Description for your new alert rule.
- Then, select the Metric for which you’d like to add an alert, an alert Condition, and a Threshold. The threshold unit type changes depending on the metric you’ve chosen.
- After that, select the Period. Metrics that reach or exceed the Threshold within the period trigger an alert.
- Lastly, (Optional) Configure Email and Webhook notifications. For more information on webhooks, see Configure a webhook on an Azure metric alert. If you do not configure email or webhook notifications, alerts will appear only in the Azure portal.
Add metrics charts to the portal dashboard
You can add Azure Storage metrics charts for any of your storage accounts to your portal dashboard.
- Firstly, slect click Edit dashboard while viewing your dashboard in the Azure portal.
- Secondly, in the Tile Gallery, select Find tiles by > Type.
- Then, select Type > Storage accounts.
- Next, in Resources, select the storage account whose metrics you wish to add to the dashboard.
- After that, select Categories > Monitoring.
- Then, drag-and-drop the chart tile onto your dashboard for the metric you’d like displayed. Repeat for all metrics you’d like displayed on the dashboard.
- Lastly, select Done customizing near the top of the dashboard when you’re done adding charts.
Configure logging
You can instruct Azure Storage to save diagnostics logs for read, write, and delete requests for the blob, table, and queue services. The data retention policy you set also applies to these logs.
- Firstly, in the Azure portal, select Storage accounts, then the name of the storage account to open the storage account blade.
- Secondly, select Diagnostics settings (classic) in the Monitoring (classic) section of the menu blade.
- Thirdly, ensure Status is set to On, and select the services for which you’d like to enable logging.
- Lastly, click Save.

Reference: Microsoft Documentation