Log Queries and Analytics
In this, we will learn about writing log queries in Azure Monitor that includes understanding query structure, sorting query results and more. Further, in this we will understanding about log analytics.
Writing a new query
A table name or the search command can be used to begin a query. However, you should start with a table name since it gives the query a defined scope and increases query performance as well as the relevancy of the results.
Table-based queries
Log data is organised in Azure Monitor tables, each of which has numerous columns. The schema pane in Log Analytics in the Analytics site displays all tables and columns. Choose a table that interests you and then examine some data:
Kusto
SecurityEvent
| take 10
The above query produces ten entries from the SecurityEvent database in no particular order. This is a standard method of looking at a table and determining its structure and content. Let’s have a look at how it’s made:
- Firstly, the query starts with the table name SecurityEvent – this part defines the scope of the query.
- Secondly, the pipe (|) character separates commands, so the output of the first one in the input of the following command. You can add any number of piped elements.
- Lastly, following the pipe is the take command, which returns a specific number of arbitrary records from the table.
Search queries
Search queries are less structured, and generally more suited for finding records that include a specific value in any of their columns:
Kusto
search in (SecurityEvent) “Cryptographic”
| take 10
This query searches the SecurityEvent table for records that contain the phrase “Cryptographic”.
Sort and top
While take is useful to get a few records, the results are selected and displayed in no particular order. To get an ordered view, you could sort by the preferred column:
Kusto
SecurityEvent
| sort by TimeGenerated desc
That could return too many results though and might also take some time.
The best way to get only the latest 10 records is to use top, which sorts the entire table on the server side and then returns the top records:
Kusto
SecurityEvent
| top 10 by TimeGenerated
Where: filtering on a condition
Filters, as indicated by their name, filter the data by a specific condition. This is the most common way to limit query results to relevant information.
To add a filter to a query, use the where operator followed by one or more conditions. For example, the following query returns only SecurityEvent records where Level equals 8:
Kusto
SecurityEvent
| where Level == 8
Specify a time range
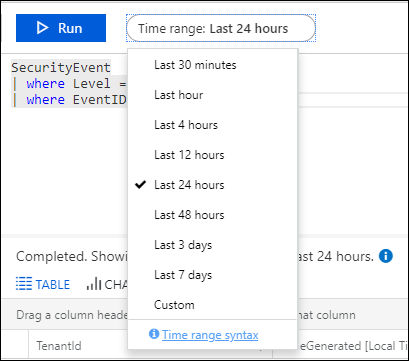
Time picker
The time picker is next to the Run button and indicates we’re querying only records from the last 24 hours. This is the default time range applied to all queries. However, to get only records from the last hour, select Last hour and run the query again.
Time filter in query
You can also define your own time range by adding a time filter to the query. It’s best to place the time filter immediately after the table name:
Kusto
SecurityEvent
| where TimeGenerated > ago(30m)
| where toint(Level) >= 10
In the above time filter ago(30m) means “30 minutes ago” so this query only returns records from the last 30 minutes. Other units of time include days (2d), minutes (25m), and seconds (10s).
Project and Extend: select and compute columns
Use project to select specific columns to include in the results:
Kusto
SecurityEvent
| top 10 by TimeGenerated
| project TimeGenerated, Computer, Activity
Further, you can also use project to rename columns and define new ones. The following example uses project to do the following:
- Firstly, select only the Computer and TimeGenerated original columns.
- Secondly, displays the Activity column as EventDetails.
- Lastly, create a new column named EventCode. The substring() function is used to get only the first four characters from the Activity field.
Kusto
SecurityEvent
| top 10 by TimeGenerated
| project Computer, TimeGenerated, EventDetails=Activity, EventCode=substring(Activity, 0, 4)

Summarize: aggregate groups of rows
Use summarize to identify groups of records, according to one or more columns, and apply aggregations to them. The most common use of summarize is count, which returns the number of results in each group. However, the following query reviews all Perf records from the last hour, groups them by ObjectName, and counts the records in each group:
Kusto
Perf
| where TimeGenerated > ago(1h)
| summarize count() by ObjectName
Another common use is to perform mathematical or statistical calculations on each group. For example, the following calculates the average CounterValue for each computer:
Kusto
Perf
| where TimeGenerated > ago(1h)
| summarize avg(CounterValue) by Computer
Log Analytics
Log Analytics is a tool in the Azure portal to edit and run log queries from data collected by Azure Monitor Logs and interactively analyze their results. Moreover, you can use Log Analytics queries to retrieve records matching particular criteria, identify trends, analyze patterns, and provide a variety of insights into your data.
Open Log Analytics
Open the Log Analytics demo environment or select Logs from the Azure Monitor menu in your subscription. This will set the initial scope to a Log Analytics workspace meaning that your query will select from all data in that workspace. If you select Logs from an Azure resource’s menu, the scope is set to only records from that resource.
Table schema
- Firstly, the left side of the screen includes the Tables tab which allows you to inspect the tables that are available in the current scope. These are grouped by Solution by default, but you change their grouping or filter them.
- Secondly, expand the Log Management solution and locate the AzureActivity table. You can expand the table to view its schema, or hover over its name to show additional information about it.
- Lastly, click Learn more to go to the table reference that documents each table and its columns. Click Preview data to have a quick look at a few recent records in the table. This can be useful to ensure that this is the data that you’re expecting before you actually run a query with it.
Write a query
Let’s go ahead and write a query using the AzureActivity table. Double-click its name to add it to the query window. You can also type directly in the window and even get intellisense that will help complete the names of tables in the current scope and KQL commands. However, this is the simplest query that we can write. It just returns all the records in a table. Run it by clicking the Run button or by pressing Shift+Enter with the cursor positioned anywhere in the query text.
Time range
- Firstly, all tables in a Log Analytics workspace have a column called TimeGenerated which is the time that the record was created. And, all queries have a time range that limits the results to records with a TimeGenerated value within that range. The time range can either be set in the query or with the selector at the top of the screen.
- However, by default, the query will return records form the last 24 hours. So, select the Time range dropdown and change it to 7 days. Then, click Run again to return the results.There, yYou can see that results are returned, but we have a message here that we’re not seeing all of the results. This is because Log Analytics can return a maximum of 10,000 records, and our query returned more records than that.
Work with charts
Let’s have a look at a query that uses numerical data that we can view in a chart. Instead of building a query, we’ll select an example query.
- Firstly, click on Queries in the left pane. This pane includes example queries that you can add to the query window. However, if you’re using your own workspace, you should have a variety of queries in multiple categories. But if you’re using the demo environment, you may only see a single Log Analytics workspaces category. Expand that to view the queries in the category.
- Secondly, cick on the query called Request Count by ResponseCode. This will add the query to the query window. Notice that the new query is separated from the other by a blank line. A query in KQL ends when it encounters a blank line, so these are seen as separate queries.
- Thirdly, the current query is the one that the cursor is positioned on. You can see that the first query is highlighted indicating it’s the current query. Click anywhere in the new query to select it and then click the Run button to run it.
- Lastly, notice that this output is a chart instead of a table like the last query. That’s because the example query uses a render command at the end. Notice that there are various options for working with the chart such as changing it to another type.
Log queries in Azure Monitor
Azure Monitor Logs is based on Azure Data Explorer, and log queries are written using the same Kusto query language (KQL). This is a rich language designed to be easy to read and author, so you should be able to start writing queries with some basic guidance.
Areas in Azure Monitor where you will use queries include the following:
- Firstly, Log Analytics. Primary tool in the Azure portal for editing log queries and interactively analyzing their results.
- Secondly, Log alert rules. Proactively identify issues from data in your workspace. Each alert rule is based on a log query that is automatically run at regular intervals.
- Then, Workbooks. Include the results of log queries using different visualizations in interactive visual reports in the Azure portal.
- Fourthly, Azure Dashboards. Pin the results of any query into an Azure dashboard which allow you to visualize log and metric data together and optionally share with other Azure users.
- After that, Logic Apps. Use the results of a log query in an automated workflow using Logic Apps.
- Next, PowerShell. Use the results of a log query in a PowerShell script from a command line or an Azure Automation runbook that uses Get-AzOperationalInsightsSearchResults.
- Lastly, Azure Monitor Logs API. Retrieve log data from the workspace from any REST API client. The API request includes a query that is run against Azure Monitor to determine the data to retrieve.

Reference: Microsoft Documentation, Documentation 2, Documentation 3