Implement Cosmos DB monitoring
Microsoft DP-200 exam is getting retired on June 30, 2021. A new replacement exam Data Engineering on Microsoft Azure (DP-203) is available.
In this we will understand about implementing Cosmos DB monitoring. However, when you have critical applications and business processes relying on Azure resources, you want to monitor those resources for their availability, performance, and operation. Here, we will describes the monitoring data generated by Azure Cosmos databases and how you can use the features of Azure Monitor to analyze and alert on this data.
You can monitor your data with client-side and server-side metrics. When using server-side metrics, you can monitor the data stored in Azure Cosmos DB with the following options:
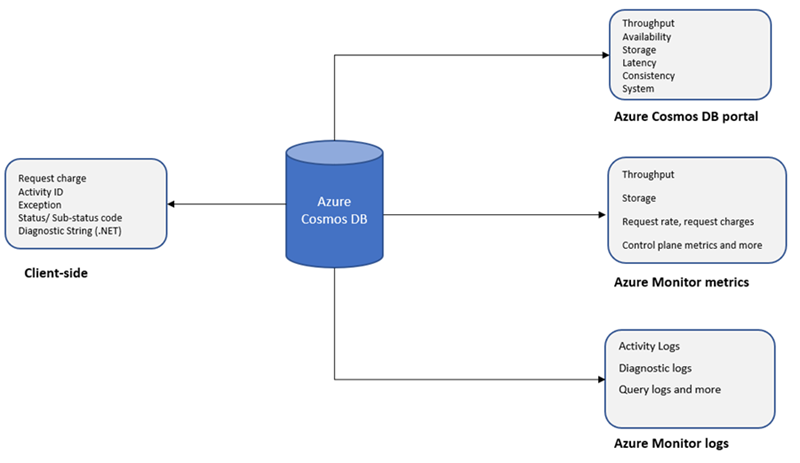
- Firstly, monitor from Azure Cosmos DB portal: You can monitor with the metrics available within the Metrics tab of the Azure Cosmos account. The metrics on this tab include throughput, storage, availability, latency, consistency, and system level metrics.
- Secondly, monitor with metrics in Azure monitor: You can monitor the metrics of your Azure Cosmos account and create dashboards from the Azure Monitor. Azure Monitor collects the Azure Cosmos DB metrics by default, you don’t have configure anything explicitly. However, these metrics are collected with one-minute granularity, the granularity may vary based on the metric you choose. By default, these metrics have a retention period of 30 days.
- Thirdly, monitor with diagnostic logs in Azure Monitor: You can monitor the logs of your Azure Cosmos account and create dashboards from the Azure Monitor. However, telemetry such as events and traces that occur at a second granularity are stored as logs.
- Lastly, Monitor programmatically with SDKs: You can monitor your Azure Cosmos account programmatically by using the .NET, Java, Python, Node.js SDKs, and the headers in REST API.
The following image shows different options available to monitor Azure Cosmos DB account through Azure portal:
Azure Monitor for Azure Cosmos DB
Azure Monitor for Azure Cosmos DB is based on the workbooks feature of Azure Monitor and uses the same monitoring data collected for Azure Cosmos DB described in the sections below. Further, you can use Azure Monitor for a view of the overall performance, failures, capacity, and operational health of all your Azure Cosmos DB resources in a unified interactive experience, and leverage the other features of Azure for detailed analysis and alerting.
Analyzing metrics
Azure Cosmos DB provides a custom experience for working with metrics. You can analyze metrics for Azure Cosmos DB with metrics from other Azure services using Metrics explorer by opening Metrics from the Azure Monitor menu. However, you can checkout how to monitor server-side latency, request unit usage, and normalized request unit usage for your Azure Cosmos DB resources.
All metrics for Azure Cosmos DB are in the namespace Cosmos DB standard metrics. You can use the following dimensions with these metrics when adding a filter to a chart:
- Firstly, CollectionName
- Secondly, DatabaseName
- Thirdly, OperationType
- Then, Region
- Lastly, StatusCode
View operation level metrics for Azure Cosmos DB
- Firstly, sign in to the Azure portal.
- Secondly, select Monitor from the left-hand navigation bar, and select Metrics.
- Thirdly, from the Metrics pane > Select a resource > choose the required subscription, and resource group. For the Resource type, select Azure Cosmos DB accounts, choose one of your existing Azure Cosmos accounts, and select Apply.
- Next, you can select a metric from the list of available metrics. After that, you can select metrics specific to request units, storage, latency, availability, Cassandra, and others.

However, in addition to these details, you can also select the Time range and Time granularity of the metrics. At max, you can view metrics for the past 30 days. After you apply the filter, a chart is displayed based on your filter. You can see the average number of request units consumed per minute for the selected period.
Add filters to metrics
You can also filter metrics and the chart displayed by a specific CollectionName, DatabaseName, OperationType, Region, and StatusCode. However, to filter the metrics, select Add filter and choose the required property such as OperationType and select a value such as Query. The graph then displays the request units consumed for the query operation for the selected period. The operations executed via Stored procedure are not logged so they are not available under the OperationType metric. Further, you can group metrics by using the Apply splitting option.
Analyzing logs
Data in Azure Monitor Logs is stored in tables which each table having its own set of unique properties. Moreover, all resource logs in Azure Monitor have the same fields followed by service-specific fields. For a list of the types of resource logs collected for Azure Cosmos DB, see Monitoring Azure Cosmos DB data reference.
Next, the Activity log is a platform login Azure that provides insight into subscription-level events. You can view it independently or route it to Monitor Logs of Azure, where you can do much more complex queries using Log Analytics. However, Azure Cosmos DB stores data in the following tables.
AzureDiagnostics: Common table used by multiple services to store Resource logs. Resource logs from Azure Cosmos DB can be identified with MICROSOFT.DOCUMENTDB.
AzureActivity: Common table that stores all records from the Activity log.

Reference: Microsoft Documentation