Implement a Log Analytics workspace
In this we will learn about Azure resources logs analytics workspace and collecting data from an Azure virtual machine with Azure Monitor.
Azure resource logs are platform logs that give you information about the actions you did on an Azure resource. Resource logs have different contents depending on the Azure service and resource type. However, each Azure resource must have its own diagnostic setting to transmit its resource logs to a Log Analytics workspace for usage with Azure Monitor Logs, Azure Event Hubs for forwarding outside of Azure, or Azure Storage for archiving.
Send to Log Analytics workspace
Send resource logs to a Log Analytics workspace to take use of Azure Monitor Logs’ functionalities, which include:
- Firstly, correlate resource log data with other monitoring data collected by Azure Monitor.
- Secondly, consolidate log entries from multiple Azure resources, subscriptions, and tenants into one location for analysis together.
- Thirdly, use log queries to perform complex analysis and gain deep insights on log data.
- Lastly, use log alerts with complex alerting logic.
Azure diagnostics mode
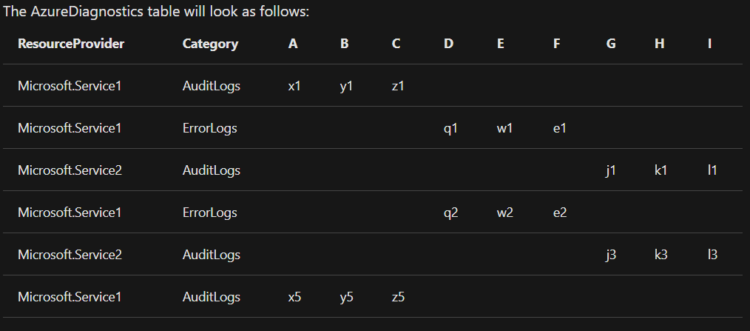
All data from any diagnostic setting is gathered in the AzureDiagnostics database in this mode. Furthermore, this is the traditional technique used by the majority of Azure services. Because many resource types contribute data to the same table, its schema is a superset of all the data types being gathered.
Consider the following scenario, in which diagnostic settings for the following data kinds are gathered in the same workspace:
- Firstly, Audit logs of service 1 (having a schema consisting of columns A, B, and C)
- Secondly, Error logs of service 1 (having a schema consisting of columns D, E, and F)
- Then, Audit logs of service 2 (having a schema consisting of columns G, H, and I)
Collecting data from an Azure virtual machine with Azure Monitor
Data from your Azure virtual machines may be collected straight into a Log Analytics workspace for detailed analysis and correlations. Azure Monitor may gather data from your Azure VMs if you install the Log Analytics VM plugin for Windows and Linux. With just a few simple steps, you can configure and gather data from your Azure Linux or Windows VMs using the VM extension.
Create a workspace
- Firstly, in the Azure portal, select All services. Then, in the list of resources, type Log Analytics. As you begin typing, the list filters based on your input. Select Log Analytics workspaces.
- After that, select Create, and then select choices for the following items:
- Firstly, provide a name for the new Log Analytics workspace, such as DefaultLAWorkspace.
- Then, select a Subscription to link to by selecting from the drop-down list if the default select is not appropriate.
- For Resource Group, select an existing resource group that contains one or more Azure virtual machine.
- After that, select the Location your VMs are deployed to. For additional information, see which regions Log Analytics is available in.
- Lastly, after providing the required information on the Log Analytics workspace pane, select OK.

Enable the Log Analytics VM Extension
The Log Analytics VM Extension is used to install the Log Analytics agent on Windows and Linux virtual machines already deployed in Azure. The addon streamlines the installation process and configures the agent to deliver data to the Log Analytics workspace you select. Check that the VM is operating before continuing; otherwise, the procedure will fail to complete properly.
- Firstly, in the Azure portal, select All services found in the upper left-hand corner. Then, in the list of resources, type Log Analytics. As you begin typing, the list filters based on your input. Select Log Analytics workspaces.
- Secondly, in your list of Log Analytics workspaces, select DefaultLAWorkspace created earlier.
- Then, on the left-hand menu, under Workspace Data Sources, select Virtual machines.
- Next, in the list of Virtual machines, select a virtual machine you want to install the agent on.
- Then, in the details for your virtual machine, select Connect. The agent is automatically installed and configured for your Log Analytics workspace. This process takes a few minutes, during which time the Status shows Connecting.
- Lastly, after you install and connect the agent, the Log Analytics connection status will be updated with This workspace.
Collect event and performance data
Azure Monitor may gather events from Windows event logs or Linux Syslog, as well as performance counters, for longer-term monitoring and reporting, and take action when a situation is discovered. Then, to get started, specify a collection of events from the Windows system log and Linux Syslog, as well as a few standard performance counters.
Data collection from Windows VM
- Firstly, select Advanced settings.
- Secondly, select Data, and then select Windows Event Logs.
- Here, you add an event log by typing in the name of the log. Type System and then select the plus sign +.
- Next, in the table, check the severities Error and Warning.
- After that, select Save at the top of the page to save the configuration.
- Then, select Windows Performance Data to enable collection of performance counters on a Windows computer.
- When you first configure Windows Performance counters for a new Log Analytics workspace, you are given the option to quickly create several common counters. They are listed with a checkbox next to each.
- Select Add the selected performance counters. They are added and preset with a ten second collection sample interval.
- Lastly, select Save at the top of the page to save the configuration.
Data collection from Linux VM
- Firstly, select Syslog.
- Here, you add an event log by typing in the name of the log. Type Syslog and then select the plus sign +.
- Thirdly, in the table, deselect the severities Info, Notice and Debug.
- Then, select Save at the top of the page to save the configuration.
- Next, select Linux Performance Data to enable collection of performance counters on a Linux computer.
- However, when you first configure Linux Performance counters for a new Log Analytics workspace, you are given the option to quickly create several common counters. They are listed with a checkbox next to each.
- Then, select Apply below configuration to to my machines and then select Add the selected performance counters. They are added and preset with a ten second collection sample interval.
- Lastly, select Save at the top of the page to save the configuration.
View data collected
Now that you have enabled data collection, lets run a simple log search example to see some data from the target VMs.
- Firstly, in the selected workspace, from the left-hand pane, select Logs.
- Then, on the Logs query page, type Perf in the query editor and select Run.

Reference: Microsoft Documentation, Documentation 2