Configuring Azure Monitor
In this tutorial, we will learn and understand about the Azure monitor and its various processes.
Monitoring data platform
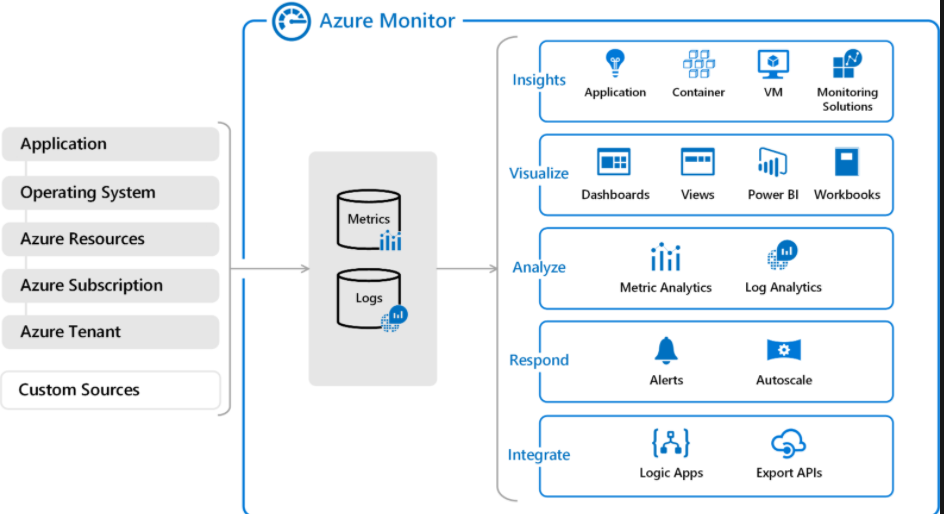
All data collected by Azure Monitor fits into one of two fundamental types, metrics and logs. However, metrics are numerical values that explain some aspect of a system at a particular point in time. As they are lightweight and capable of supporting near real-time scenarios. In this, the logs contain different kinds of data organized into records with different sets of properties for each type. Telemetry like events and traces are stored as logs in addition to performance data so that it can all be combined for analysis.
However, for many Azure resources, you’ll see data collected by Azure Monitor on the Overview page in the Azure portal. This uses a version of the Kusto query language used by Azure Data Explorer. And it is acceptable for simple log queries. But, it also includes advanced functionality like aggregations, joins, and smart analytics.
What data does Azure Monitor collect?
Azure Monitor has the ability to collect data from a variety of sources. That is to say, you can monitor data for your applications in levels ranging from your application, or any operating system. However, it collects data from each of the following tiers:
- Firstly, Application monitoring data that defines data performance and functionality of the code you have written, regardless of its platform.
- Secondly, Guest OS monitoring data that defines the data about the operating system on which your application is running.
- Thirdly, Azure resource monitoring data that is about the operation of an Azure resource.
- Then, Azure subscription monitoring data that is the data about the operation and management of an Azure subscription.
- Lastly, Azure tenant monitoring data that is the data about the operation of tenant-level Azure services, such as Azure Active Directory.

After creating an Azure subscription and start adding resources such as virtual machines and web apps, Azure Monitor starts collecting data. Moreover, extend the data you’re collecting into the actual operation of the resources by enabling diagnostics and adding an agent to compute resources. Further, this will collect telemetry for the internal operation of the resource. And, then it will allow you to configure different data sources to collect logs and metrics from Windows and Linux guest operating systems.
Custom sources
Azure Monitor collects the log data from any REST client using the Data Collector API. Moreover, this allows you to create custom monitoring scenarios and extend monitoring to resources that don’t expose telemetry through other sources.
Insights
Monitoring data is useful when it can increase your visibility into the operation of your computing environment. However, Azure Monitor includes several features and tools that provide valuable insights into your applications and other resources. Further, monitor solutions and features like Application Insights and Azure Monitor for containers providing deep insights into different aspects of your application and specific Azure services.
Application Insights
Application Insights is responsible for monitoring the availability, performance, and usage of your web applications. Moreover, it holds the powerful data analysis platform in Azure Monitor for providing deep insights into your application’s operations. And further, diagnosing errors without waiting for a user to report them. Moreover, application Insights includes connection points to a variety of development tools and integrates with Visual Studio to support your DevOps processes.

Reference: Microsoft Documentation