Azure Monitor Metrics overview
Azure Monitor Metrics is an Azure Monitor feature that captures numeric data from monitored resources and stores it in a time-series database. Azure Monitor metrics are lightweight and capable of supporting near real-time scenarios, making them particularly helpful for issue identification and alerting. You may use metrics explorer to interactively study them, be alerted when a value passes a threshold with an alert, or view them in a spreadsheet or dashboard.
What can you do with Azure Monitor Metrics?
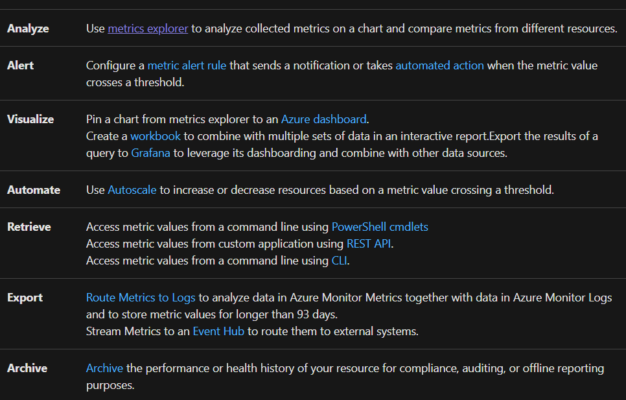
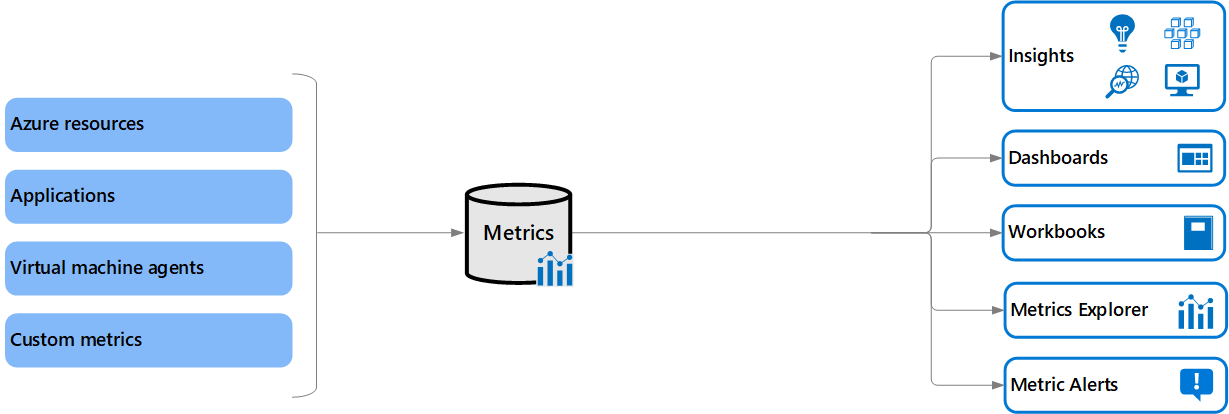
Data collection
Azure Monitor gets metrics from three different sources. These metrics may be reviewed together once they’ve been gathered in the Azure Monitor metric database, regardless of their source.
- Azure has many resources. Azure resources generate platform metrics, which provide insight into their health and performance. Without any setup, each type of resource generates its own set of metrics. Platform metrics are gathered at a one-minute interval from Azure resources unless otherwise specified in the metric’s description.
- Applications. Application Insights creates metrics for your monitored applications to help you spot performance issues and analyze trends in how your app is utilized. Server response time and Browser exceptions are examples of such values.
- Agents for virtual machines. Metrics are gathered from a virtual machine’s guest operating system. Using the Windows Diagnostic Extension (WAD) and the InfluxData Telegraf Agent, enable guest OS metrics for Windows virtual machines and Linux virtual machines, respectively.
- Custom metrics. In addition to the common metrics that are accessible by default, you may specify your own measurements. Custom metrics may be defined in your application and monitored by Application Insights, or you can use the custom metrics API to build custom metrics for an Azure service.

Metrics explorer
To interactively evaluate the data in your metric database and track the values of several metrics across time, use Metrics Explorer. The charts may be pinned to a dashboard and seen with other visualizations. The Azure monitoring REST API may also be used to get metrics.
Data structure
The data generated by Azure Monitor Metrics is saved in a time-series database, which is designed for evaluating data that has been time-stamped. Each metric value set is a time series with the following characteristics:
- Firstly, the time the value was collected
- Secondly, the resource the value is associated with
- Thirdly, namespace that acts like a category for the metric
- Then, metric name
- The value itself
- Lastly, some metrics may have multiple dimensions as described in Multi-dimensional metrics. Custom metrics can have up to 10 dimensions.
Multi-dimensional metrics
One of the difficulties with metric data is that it frequently lacks context for the quantities obtained. Multi-dimensional metrics in Azure Monitor help to solve this problem. Furthermore, a metric’s dimensions are name-value pairs that include extra information to characterise the metric’s value. For instance, a metric Available disc space might have a Drive dimension with values C:, D:, allowing users to see available disc space for all drives or for each drive separately.
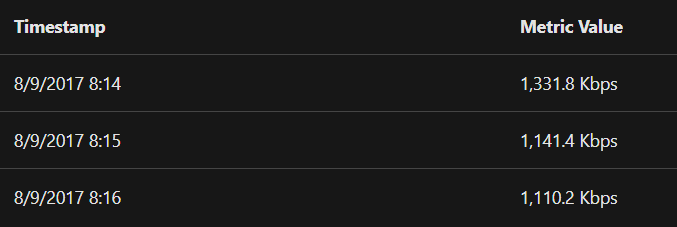
Network Throughput
Retention of Metrics
For most resources in Azure, metrics are stored for 93 days. However, there are some exceptions:
Guest OS metrics
- Firstly, Classic guest OS metrics. These are performance counters collected by the Windows Diagnostic Extension (WAD) or the Linux Diagnostic Extension (LAD) and routed to an Azure storage account. Retention for these metrics is 14 days.
- Secondly, Guest OS metrics sent to Azure Monitor Metrics. These are performance counters collected by the Windows Diagnostic Extension (WAD) and sent to the Azure Monitor data sink, or via the InfluxData Telegraf Agent on Linux machines. Retention for these metrics is 93 days.
- Lastly, Guest OS metrics collected by Log Analytics agent. These are performance counters collected by the Log Analytics agent and sent to a Log Analytics workspace. Retention for these metrics is 31 days, and can be extended up to 2 years.

Reference: Microsoft Documentation