OpsWorks Monitoring
Monitor stacks by
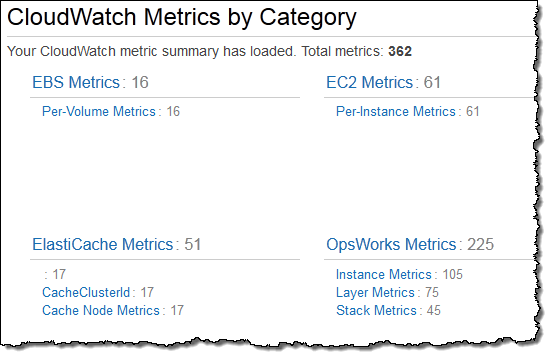
- CloudWatch lists 13 custom metrics for each instance in stack.
- CloudTrail logs every AWS OpsWorks Stacks API call and store data in S3 bucket.
- CloudWatch Logs can monitor stack’s system, application, and custom logs.
- For Linux stacksuse the 13 custom metrics on Monitoring page.
- For Windows stacks, monitor standard EC2 metrics with CloudWatch console.
- The Monitoring page does not shoe Windows metrics.
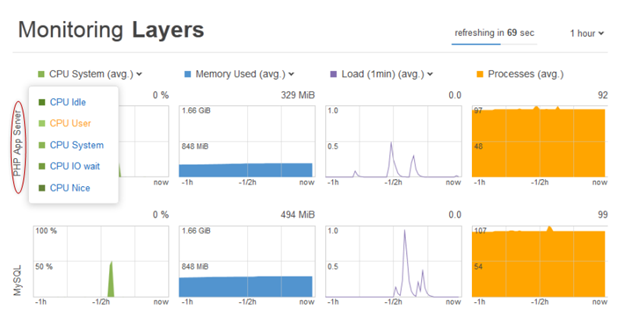
- The Monitoring page shows metrics for entire stack, a layer, or an instance.
Metrics
- cpu_idle – The percentage of time that the CPU is idle.
- cpu_nice – The percentage of time that the CPU is handling processes with a positive nice value, which have a lower scheduling priority.
- cpu_system – The percentage of time that the CPU is handling system operations.
- cpu_user – The percentage of time that the CPU is handling user operations.
- memory_buffers – The amount of buffered memory.
- memory_cached – The amount of cached memory.
- memory_free – The amount of free memory.
- memory_used – The amount of memory in use.
- load_1 – The load averaged over a one-minute window.
- load_15 – The load averaged over a 15-minute window.
- procs – The number of active processes.
OpsWorks Stacks namespace, and provide metrics for the following dimensions:
- StackId – Average values for a stack.
- LayerId – Average values for a layer.
- InstanceId – Average values for an instance.