CloudWatch Dashboard
- They are customizable home pages in the CloudWatch console
- Use to monitor resources in a single view
- Resources may be spread across various regions.
- Can also create customized views of metrics and alarms for resources.
- Create single view for selected metrics
- Create alarms to check health of resources and applications across regions.
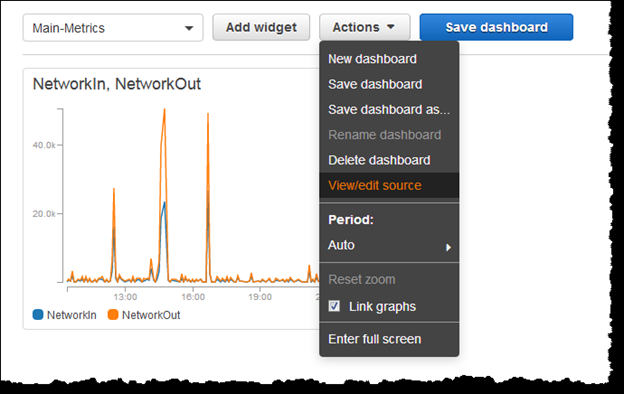
- select custom color for each metric on each graph
- Dashboards can be created by the console, the AWS CLI, or the PutDashboard API.
- Following tasks can be done
- Create a Dashboard
- Add or Remove a Graph
- Move or Resize a Graph
- Edit a Graph
- Add Graph Metrics Manually on a CloudWatch Dashboard
- Rename a Graph
- Add or Remove a Text Widget
- Add or Remove an Alarm
- Monitor Resources in Multiple Regions
- Link and Unlink Graphs
- Add a Dashboard to Your Favorites List
- Change the Period Override Setting or Refresh Interval
- Change the Time Range or Time Zone Format