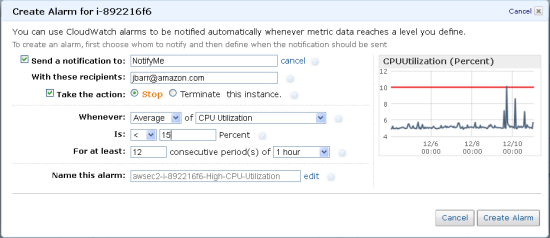
Understanding CloudWatch Alarms
- Watches a single metric over a specified time period, and performs specified actions,
- It initiates actions on behalf.
- An alarm can result in taking action on basis of metric value against a threshold over time period.
- Action can be notification to SNS or Auto Scaling policy.
- Can add alarms to dashboards.
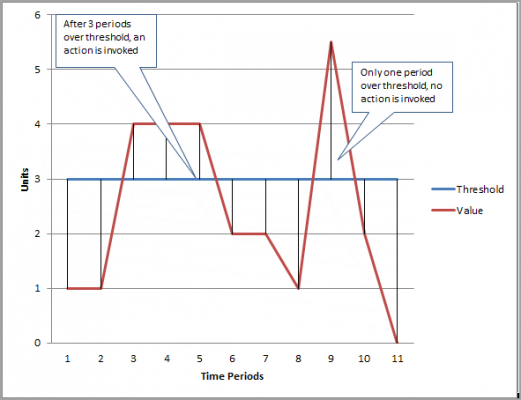
- Actions only for sustained state changes only.
- Always select a period greater or equal to the frequency of the metric to be monitored.
- Maximum limit to create 5000 alarms/Region in a AWS account.
- To create or update an alarm, use PutMetricAlarm API action
- Alarm names must contain only ASCII characters.
- list currently configured alarms, by DescribeAlarms (mon-describe-alarms).
- Disable or enable alarms by DisableAlarmActions and EnableAlarmActions
- Test alarm by setting it to any state using SetAlarmState (mon-set-alarm-state).
- View alarm’s history using DescribeAlarmHistory (mon-describe-alarm-history).
- CloudWatch saves alarm history for two weeks.
- The value of evaluation periods number for alarm multiplied by evaluation period length, should be less than one day.
- Following permissions are required to create or change a Cloudwatch alarm
- For alarms with EC2 actions
- iam:CreateServiceLinkedRole
- iam:GetPolicy
- iam:GetPolicyVersion
- iam:GetRole
- For alarms on EC2 instance status metrics
- ec2:DescribeInstanceStatus
- ec2:DescribeInstances
- For alarms with stop actions
- ec2:StopInstances
- For alarms with terminate actions
- ec2:TerminateInstances
- No specific permissions are needed for alarms with recover actions.
- For alarms with EC2 actions
CloudWatch Monitoring
- Cloudwatch can be used to monitor
- EC2 instances
- Autoscaling Groups
- ELBs
- Route53 Health Checks
- EBS Volumes
- Storage Gateways
- CloudFront
- DynamoDB
- Other AWS services
- logs generated by applications and services.
- EC2 will by default monitor instances @5 minute intervals
- EC2 instances can monitor instances @1 minute intervals if the ‘detailed monitoring’ option is set on the instance
- CloudWatch monitors following, by default
- CPU
- Network
- Disk
- Status Checks
- RAM utilization metric
- is a custom metric
- has to be added manually to EC2 instances for tracking.
- 2 types of Status Checks:
- System Status Checks (Physical Host):
- Checks the underlying physical host
- Checks for loss of network connectivity
- Checks for loss of system power
- Checks for software issues on the physical host
- Checks for hardware issues on the physical host
- Stop the instance and start again, for resolution (will switch physical hosts)
- Instance Status Checks
- Checks the VM itself
- Checks for failed system status checks
- Checks for mis-configured networking or startup configs
- Checks for exhausted memory
- Checks for corrupted file systems
- Checks for an incompatible kernel
- rebooting instance or changing instance OS, for troubleshooting
- System Status Checks (Physical Host):
- CloudWatch metrics are saved for 2 weeks only, by default
- use GetMetricStatistics API endpoint to get data more than 2 weeks
- Data from terminated EC2/ ELB instance, after termination can be obtained up to 2 weeks
- As per service the default metrics can be 1 min or 3-5 minutes
- The minimum granularity for custom metrics is 1 minute
- Alarms can be created to monitor any CloudWatch metric in account
- Alarms can include EC2, CPU, ELB, Latency, or even changes on AWS bill
- Following can be specified in a alarm
- actions can be set
- triggering lambda functions or SNS notifications against a threshold
Alarm has states
- OK –metric within threshold.
- ALARM –metric outside threshold.
- INSUFFICIENT_DATA – indicates that alarm has initiated but metric is not accessible
Data point reported to CloudWatch classified as
- Not breaching (within the threshold)
- Breaching (violating the threshold)
- Missing
Missing data points against each alarm, can be treated as
- notBreaching – Missing data points are treated as good and within the threshold,
- breaching –data points are missing, considered as bad and assume to breach threshold
- ignore –Present alarm state is held
- missing –missing data points are not taken by the alarm, during the evaluation of changing the state
Become an AWS Certified Security – Specialty Professional with hundreds of practice tests and expert guidance. Try Free Now!