Analyze Resource Utilization and Consumption
Exam AZ-103: Microsoft Azure Administrator is retired. AZ-104 is available.
Configure Diagnostic Settings on Resources
In order to configure diagnostic settings on resources it is important to enable diagnostic logs for the resources, from the resource itself. The Azure Monitor, PowerShell, the command-line interface, Azure Monitor REST API or from within a template. Such that all resources can have diagnostic logs enabled.
Steps used to configure diagnostics settings on resources –
- Firstly we enable diagnostic logs from the Azure Monitor after which we will have to scroll down to settings to find diagnostic settings.
- Next, we can go ahead and select our subscriptions or subscription.
- Thereafter we can have filter on resource group which we are going to do. Also as we notice that we have three resources selected which we can filter on these as required.
- Then we are going to go ahead and enable diagnostic logs for DemoVM-ip, and go ahead and select it, and then turn on the log.
- Now the first thing we need to do is provide a name and our diagnostic logs can be sent to any of the three locations. This can archive them to a storage account, we can stream them to an event hub or send them to Log Analytics for further analysis.
- In this step we have to go ahead and configure the storage account. and go ahead to select that.
- We can go ahead and select the log and the metric.
- Lastly, we go ahead and click Save, and that’s all there is for capturing diagnostic logs from within the portal.
Create a Baseline for Resources
The process of Azure automation offers reliable management and a predictable baseline across the azure environment. Primarily Azure automation contains four main features –
- Process automation – We can leverage process automation to automate repeatable management tasks which can be done through runbooks. For instance if we can have a runbook that would start and stop all the virtual machines in a resource group or subscription on a schedule.
- Configuration management – In the process of configuration management we can track inventory. It’s also here where we can track changes as well as configure desire state configuration or DSC.
- Update management – DSC is critical to your azure virtual machines because it prevents your virtual machines from going out of scope
- Shared capabilities – This is a accomplished through a simple powershell script.
Create and Test Alerts
In Azure Monitor, metric alerts helps to get notified when one of our metrics cross a threshold. Where, metric alerts work on a range of multi-dimensional platform metrics, custom metrics, Application Insights standard and custom metrics.
How to create with Azure Portal?
Step 1 – In Azure portal, click on Monitor. The Monitor blade consolidates all your monitoring settings and data in one view.
Step 2 – Click Alerts then click + New alert rule.
Step 3 – Click Select target, in the context pane that loads, select a target resource that we want to alert on. Use Subscription and Resource type drop-downs to find the resource we wish to monitor. We can also use the search bar to find the resource.
Step 4 – If the selected resource has metrics we can create alerts on, Available signals on the bottom right will include metrics.
Step 5 – Once we have selected a target resource, click on Add condition.
Step 6 – We will see a list of signals supported for the resource, select the metric we want to create an alert on.
Step 7 – Optionally, refine the metric by adjusting Period and Aggregation. If the metric has dimensions, we will see Dimensions table presented.
Step 8 – Select one or more values per dimension. The metric alert will run evaluate the condition for all combinations of values selected.
Step 9 – We will see a chart for the metric for the last 6 hours. Then define the alert parameters – Condition Type, Frequency, Operator and Threshold or Sensitivity, this will determine the logic which the metric alert rule will evaluate.
Step 10 – Now if we are using a static threshold, the metric chart can help determine what might be a reasonable threshold. If we are using a Dynamic Thresholds, the metric chart will display the calculated thresholds based on recent data.
Step 11- Click Done
Step 12- Alternatively, add another criteria if we want to monitor a complex alert rule. At present users can have alert rules with Dynamic Thresholds criteria as a single criterion.
Step 13 – Fill in Alert details like Alert Rule Name, Description and Severity
Step 14 – Add an action group to the alert either by selecting an existing action group or creating a new action group.
Step 15 – Click Done to save the metric alert rule.
How to View and Manage with Azure portal?
We can view and manage metric alert rules using the Manage Rules blade under Alerts. Such that the procedure below shows how to view the metric alert rules and edit one of them.
- In Azure portal, navigate to Monitor
- Click on Alerts and Manage rules
- In the Manage rules blade, we can view all the alert rules across subscriptions.
- We can further filter the rules using Resource group, Resource type and Resource. Also if we want to see only metric alerts, select Signal type as Metrics.
- Click on the name of the metric alert rule we want to edit
- In the Edit Rule, click on the Alert criteria we want to edit. We can then change the metric, threshold condition and other fields as required
- Click Done to save your edits.
Analyze Alerts Cross Subscription
Azure Monitor gives the unified alerts experience, which we can now see with all different types of alerts across Azure, spanning multiple subscriptions, in one single pane of glass. We shall now discuss how we can view alert instances, and how to deep-dive on the portal to find specific alert instances for troubleshooting.
We shall use the following steps to analyze alerts cross subscriptions
Step 1 – Use one of the following ways to land on Alert Pages.
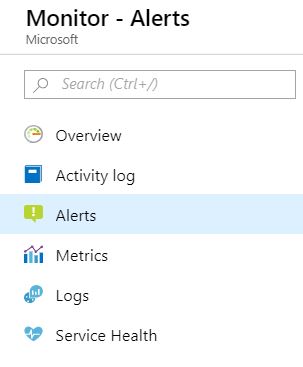
1. In the portal, select Monitor and under the Monitor section – choose Alerts.
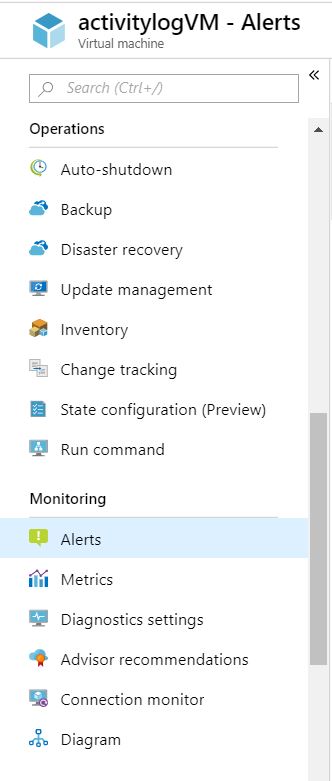
2. We can navigate to Alerts from within the context of a specific resource. Once a resource is opened, navigate through its table of contents to the Monitoring section, and choose Alerts, with the landing page being pre-filtered for alerts on that specific resource.
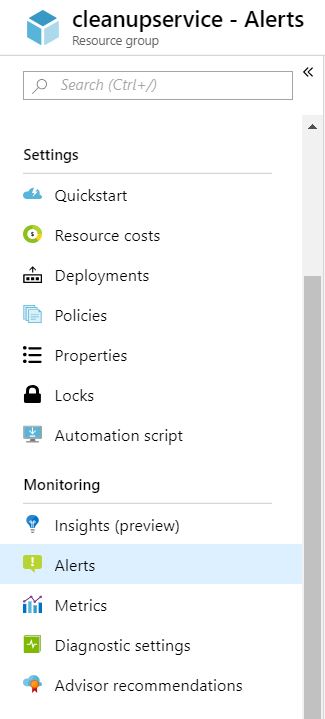
3. We can navigate to Alerts from within the context of a specific resource group. Once a resource group is opened, navigate through its table of contents to the Monitoring section, and choose Alerts, with the landing page being pre-filtered for alerts on that specific resource group.
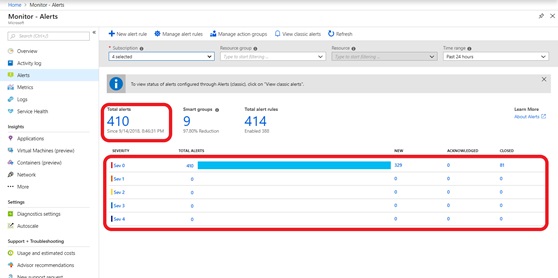
Step 2 – In the second step we will will land on the Alerts Summary page, which gives us an overview of all the alert instances across Azure. We can modify the summary view by selecting multiple subscriptions (a maximum of 5) or by filtering across resource groups, specific resources, or time ranges. Thereafter click on either Total Alerts or any of the severity bands to go to the list view for the alerts.
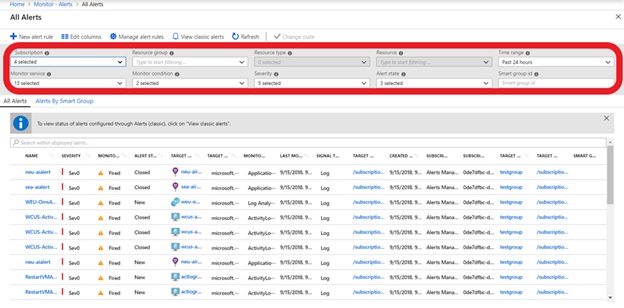
Step 3 – We will land on the All Alerts page, where we will see all the alert instances across Azure listed out. In case if we are coming to the portal from an alert notification, then we can use the filters available to narrow in on that specific alert instance. Besides the filters available on the previous page, we can now also filter on the basis of monitor service , monitor condition, severity, alert state (new/acknowledged/closed), or the smart group ID.
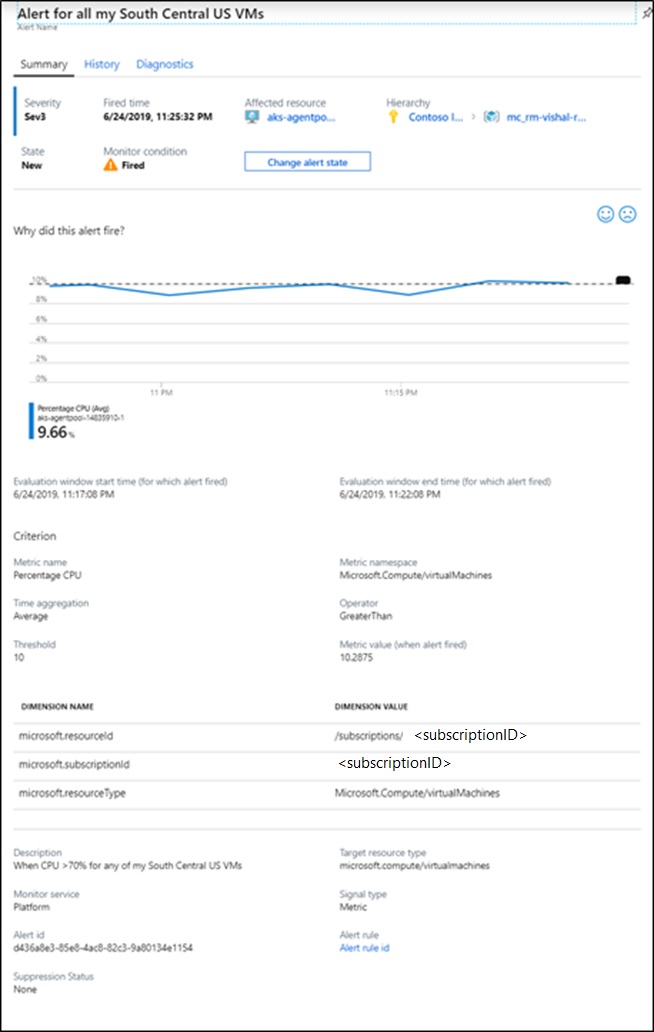
Step 4 – Clicking on any alert instance opens up the Alert Details page, allowing to deep-dive into information about that specific alert instance.
Analyze Metrics Across Subscription
Metrics in Azure
Metrics in Azure Monitor are the series of measured values and counts that are collected and stored over time.
- The standard metrics are provided to you by the Azure platform itself. Standard metrics reflect the health and usage statistics of your Azure resources.
- The custom metrics are sent to Azure by your applications using the Application Insights API for custom events and metrics, Windows Azure Diagnostics (WAD) extension, or by Azure Monitor REST API.
Create views with Multiple Metrics and Charts
We can create charts that plot multiple metrics lines or show multiple metric charts at once. This functionality allows to –
- correlate related metrics on the same graph to see how one value is related to another
- display metrics with different units of measure in close proximity
- visually aggregate and compare metrics from multiple resources
How to apply filters to charts?
- Select Add Filter above the chart.
- Select the dimension (property) to filtered.

3. Select which dimension values we want to include when plotting the chart.
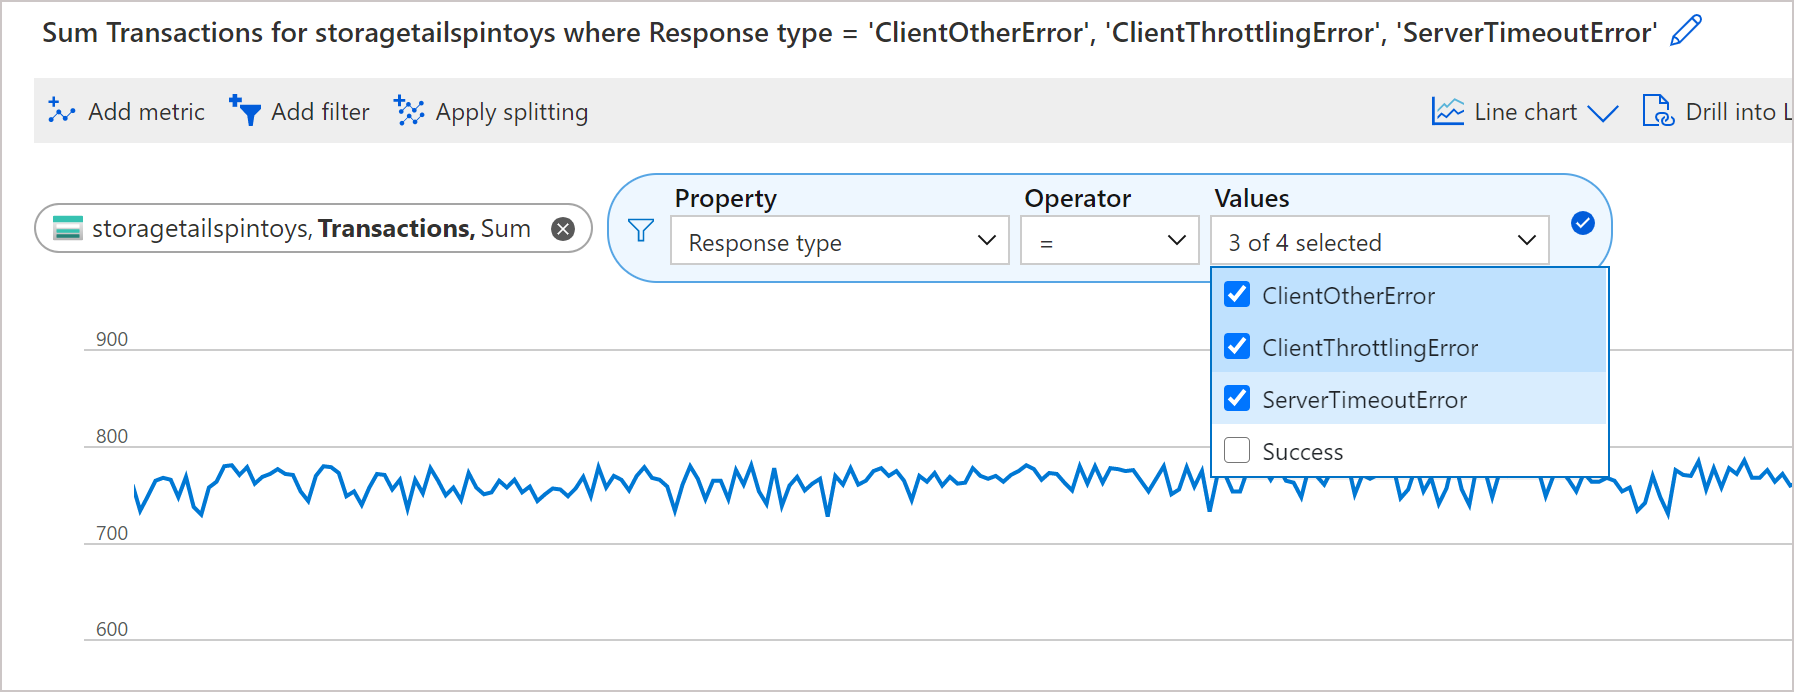
4. After selecting the filter values, click away from the Filter Selector to close it. Now the chart shows how many storage transactions have failed.
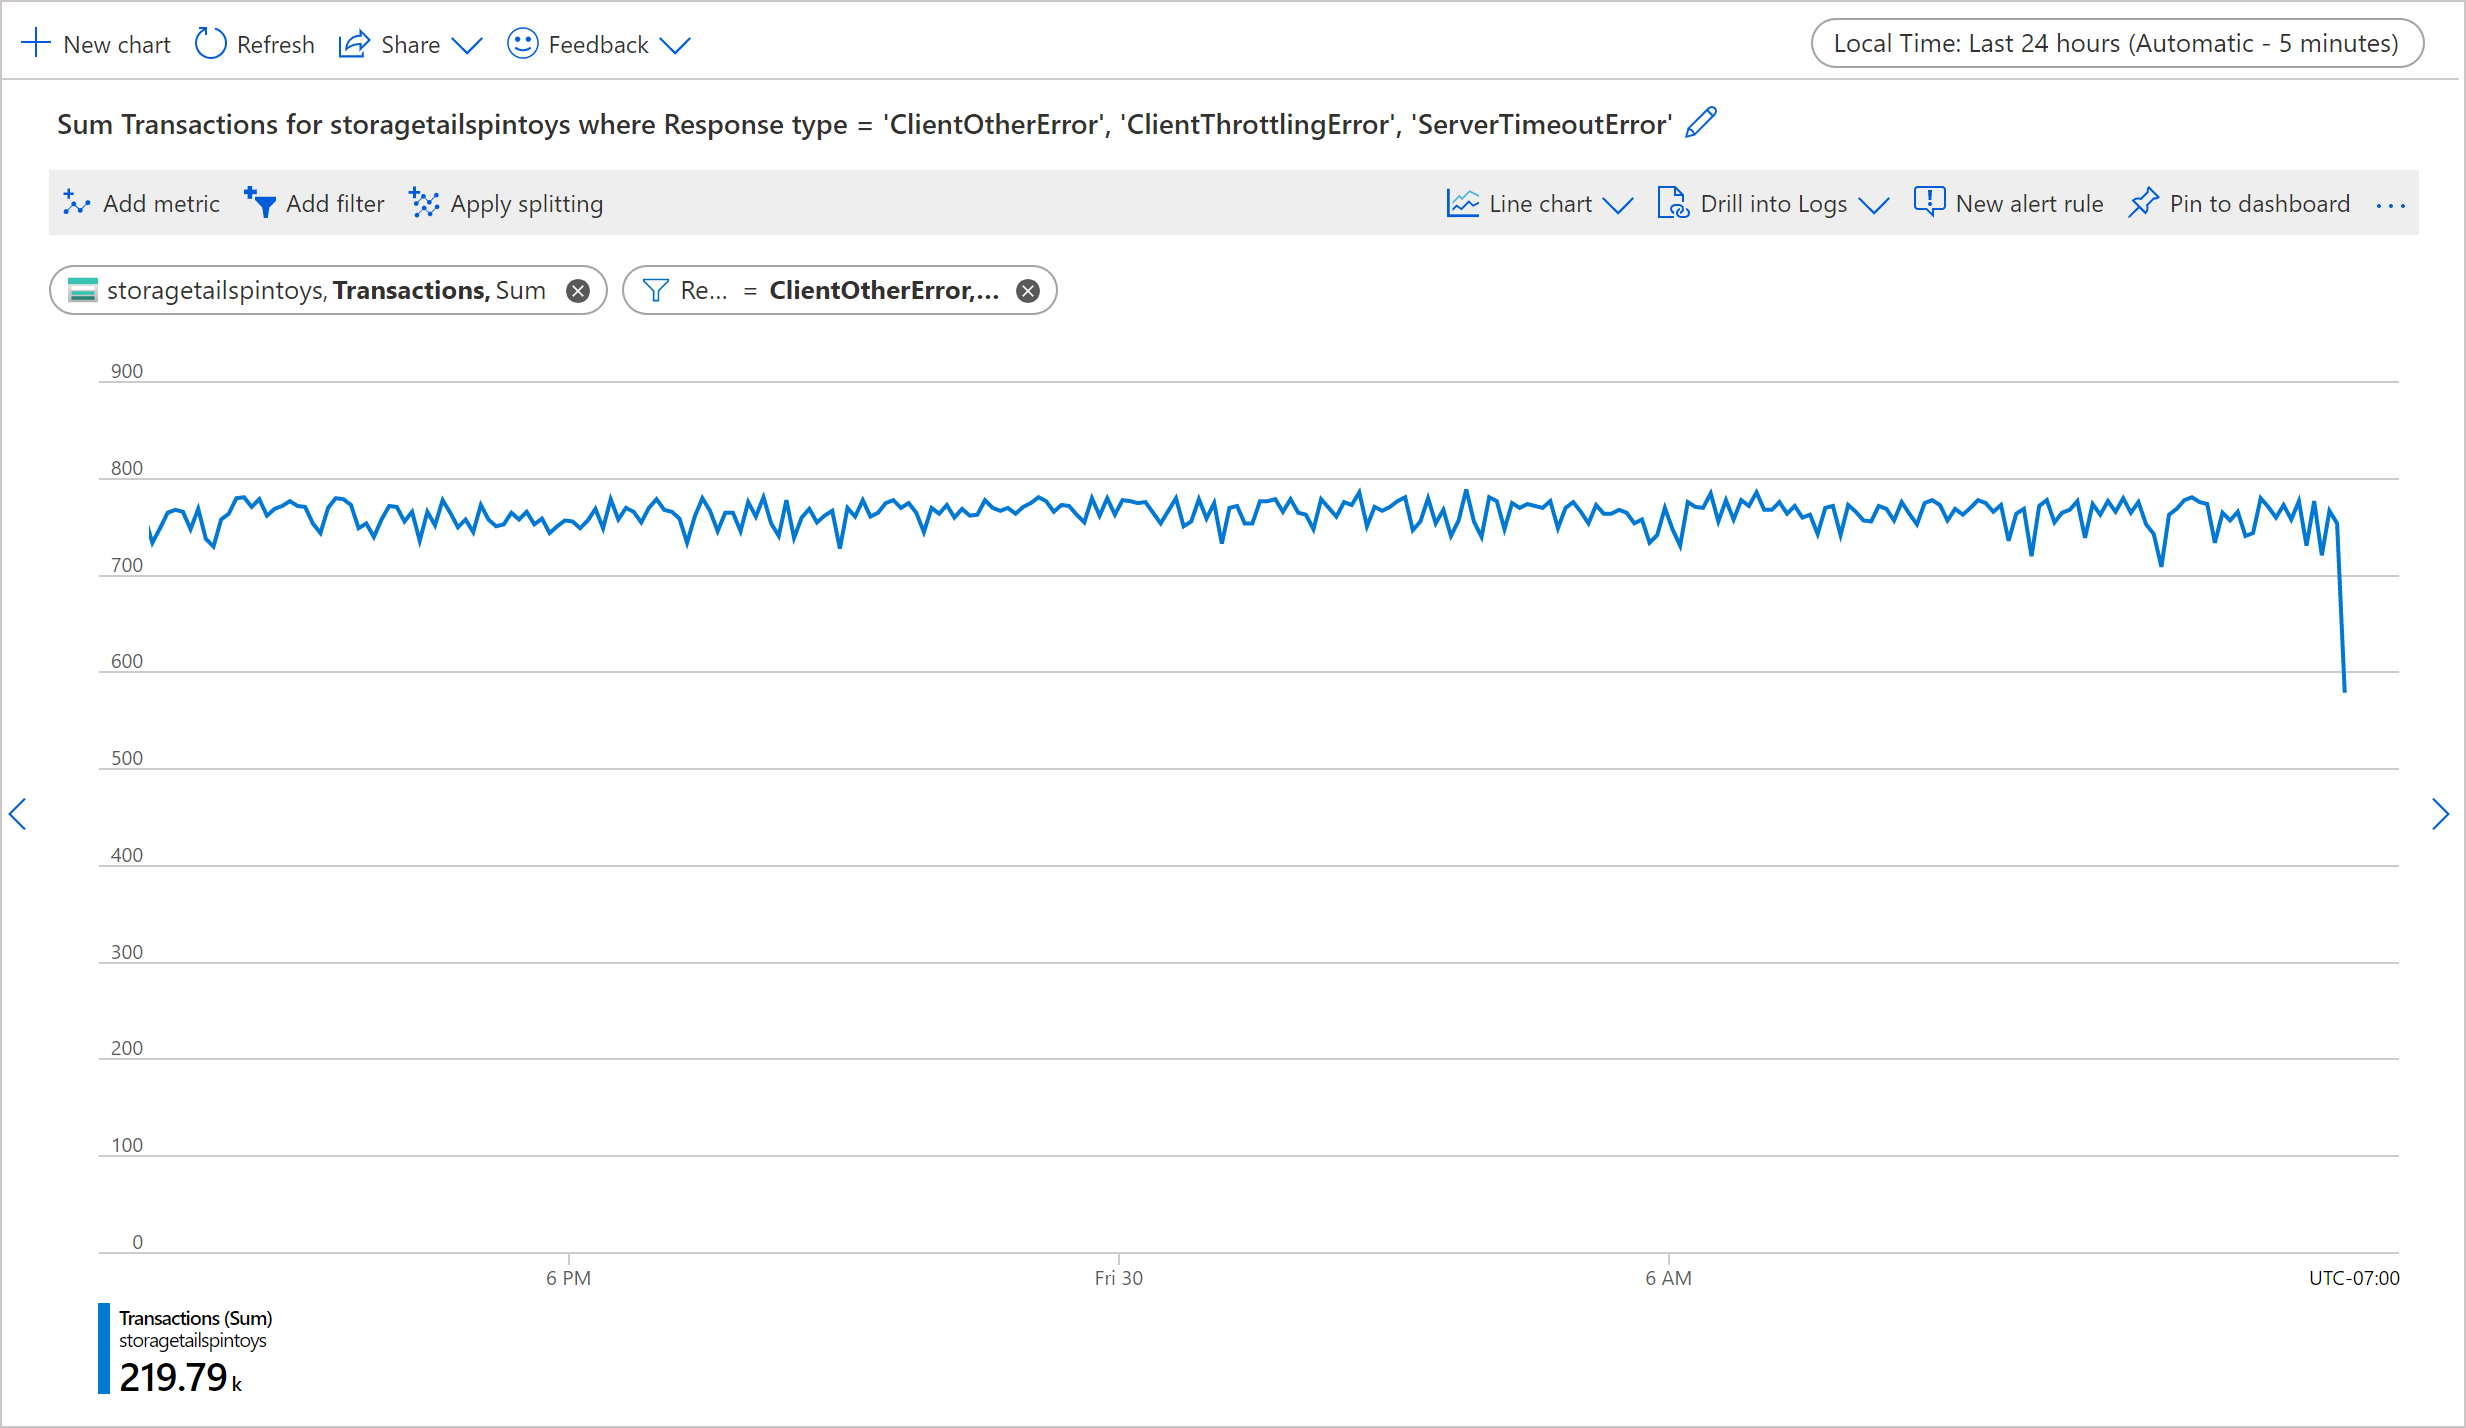
5. You can repeat steps 1-4 to apply multiple filters to the same charts.
Create Action Groups
We can define an action group as a collection of notification preferences defined by the owner of an Azure subscription. Azure Monitor and Service Health alerts use action groups to notify users that an alert has been triggered. We configure an action to notify a person by email or SMS, they receive a confirmation indicating they have been added to the action group.
How to create an action group by using the using the Azure Portal?
- In the Azure portal, select Monitor. The Monitor pane consolidates all your monitoring settings and data in one view.
- Select Alerts then select Manage actions
- Select Add action group, and fill in the fields.
- Enter a name in the Action group name box, and enter a name in the Short name box. The short name is used in place of a full action group name when notifications are sent using this group.
- The Subscription box autofills with your current subscription. This subscription is the one in which the action group is saved.
- Select the Resource group in which the action group is saved.
- Define a list of actions. Provide the following for each action:
- Name: Enter a unique identifier for this action.
- Action Type: Select Email/SMS/Push/Voice, Logic App, Webhook, ITSM, or Automation Runbook.
- Details: Based on the action type, enter a phone number, email address, webhook URI, Azure app, ITSM connection, or Automation runbook. For ITSM Action, additionally specify Work Item and other fields your ITSM tool requires.
- Common alert schema: You can choose to enable the common alert schema, which provides the advantage of having a single extensible and unified alert payload across all the alert services in Azure Monitor.
8. Select OK to create the action group.
Monitor for Unused Resources
Steps used to Monitor the Unused Resources –
Step 1 – Open the Azure Virtual Machines view
In this step Log on to the TrueSight console and then in the left navigation pane, click Capacity > Views > Cloud > Azure > Virtual Machines.

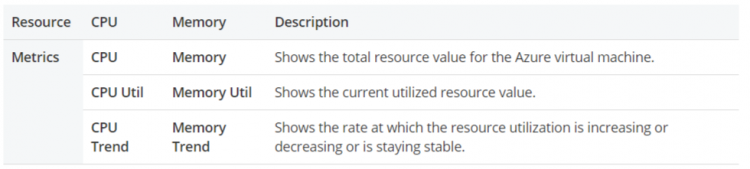
Step 2 – View the VM-specific core metric details
In this step on the Virtual Machines page, review the following column values (metrics) to understand the utilization of the key resources.
Step 3 – Configure the optimization behavior settings
In this step on the Virtual Machines page, select > Edit Settings. Thereafter
in the Other Settings, configure the optimization behavior settings.
Step 4 – View the recommendations for the overallocated and idle VMs
In this steps Click the Recommendations tab. Such that the recommendations page displays a table that lists overallocated and idle VMs with efficiency and risk related issues, and recommendations to fix them.

Step 5 – Save an offline copy of the recommendations
Click Settings > Export to Excel to export the recommendations to an Excel file for offline reference or to share it with other stakeholders.
Monitor Spend
We can monitor cost using some of the given tools – Tags, Cost breakdown and burn & Cost Analysis.
Add tags to resources to group billing data
We can use tags to group billing data for supported services. So when we run several VMs for different teams, then we can use tags to categorize costs by cost center or environment
Steps to monitor costs when using Azure Services –
After you have your Azure services running, regularly check charges. You can see the current spending and burn rate in the Azure portal.
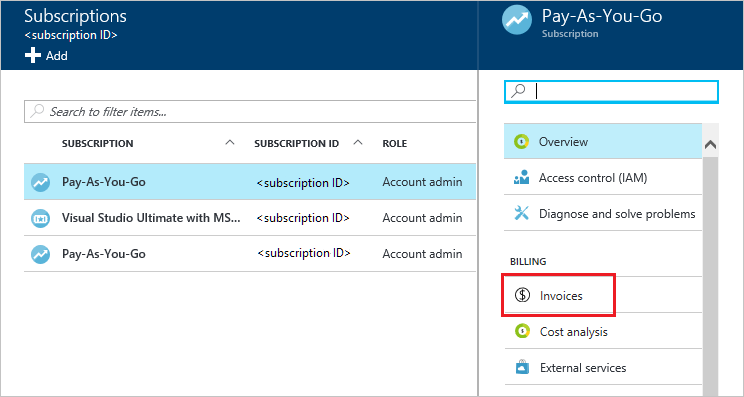
Step 1 – Visit the Subscriptions in the Azure portal and select a subscription.
Step 2 – If it’s supported for the subscription, such as to see the cost breakdown and burn rate.
Step 3 – Click Cost analysis in the list one the left to see the cost breakdown by resource. After we add a service, wait 24 hours for the data to display.
Step 4 – We can filter by different properties like tags, resource type, resource group, and timespan. Click Apply to confirm the filters and Download if we want to export the view to a comma-separated values (.csv) file.
Step 5 – Additionally, we can click a resource to see daily spend history and how much the resource costs each day.
Report on Spend
In order
For most subscriptions, we can download your invoice from the Azure portal. If we have a Microsoft Customer Agreement, then we look for the Download invoices for a billing profile.
Steps to Download invoices for an individual subscription
- Select subscription from the Subscriptions page in the Azure portal as a user with access to invoices.
- Select Invoices.
- Click Download Invoice to view a copy of PDF invoice. If it says Not available, see Why don’t I see an invoice for the last billing period?
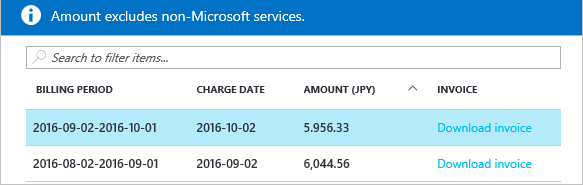
- You can also view your daily usage by clicking the billing period.
Utilize Log Search query functions
Following are some of the Log Search Query Function
Search a term
Search command is typically used to search a specific term. In the following example, all columns in all tables are scanned for the term “error”:
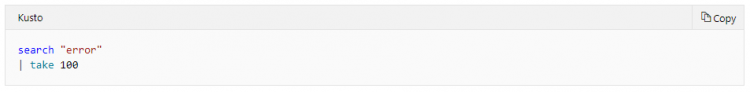
Table scoping
To search a term in a specific table, add in (table-name) just after the search operator:
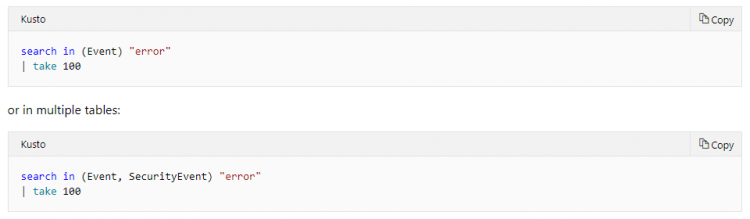
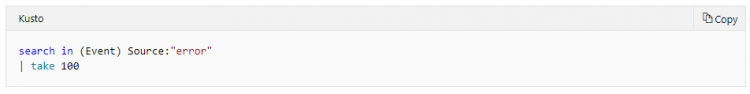
Table and column scoping
By default, search will evaluate all columns in the data set. To search only a specific column, use this syntax:
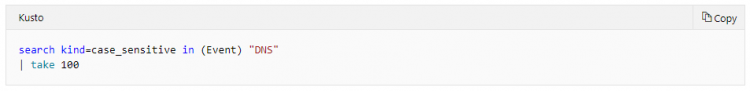
Case-sensitivity
By default, term search is case-insensitive, so searching “dns” could yield results such as “DNS”, “dns”, or “Dns”. To make the search case-sensitive, use the kind option:
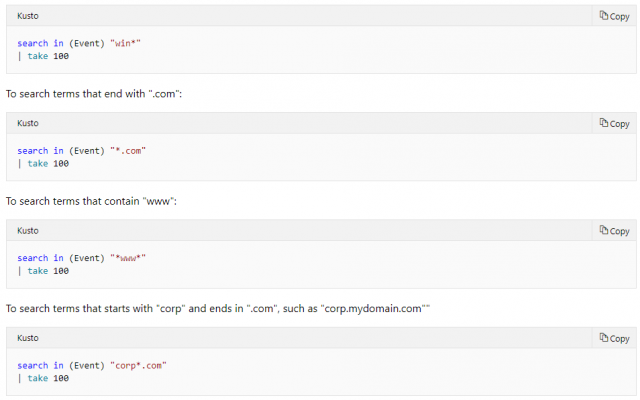
Use wild cards
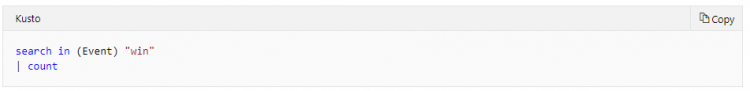
The search command supports wild cards, at the beginning, end or middle of a term. To search terms that start with “win”:
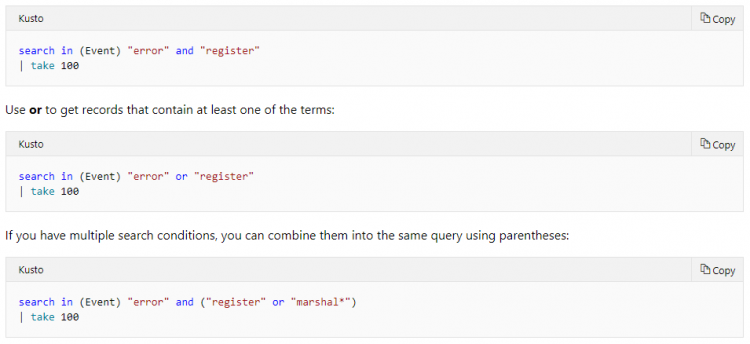
Add and / or to search queries
Use and to search for records that contain multiple terms:
Pipe search queries
Just like any other command, search can be piped so search results can be filtered, sorted, and aggregated. For example, to get the number of Event records that contain “win”: