Visualize a Log Query
In this we will understand about how to visualize a log query using Log Analytics that is a dedicated portal used to work with log queries and their results. Features include the ability to edit a query on multiple lines, selectively execute code, context sensitive Intellisense, and Smart Analytics.
Visualizing log query
- Firstly, open Log Analytics by selecting Logs in the Azure Monitor menu. It starts with a new blank query.
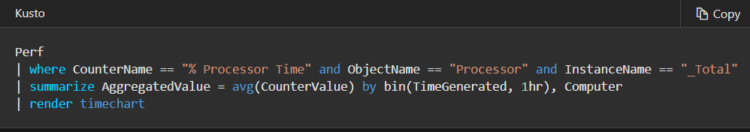
- Secondly, enter the following query to return processor utilization records for both Windows and Linux computers, grouped by Computer and TimeGenerated, and displayed in a visual chart. Then, click Run to run the query and view the resulting chart.
- Next, save the query by selecting the Save button from the top of the page.

- After that, in the Save Query control panel, provide a name such as Azure VMs – Processor Utilization. And, a category such as Dashboards and then click Save. This way you can create a library of common queries that you can use and modify. Finally, pin this to the shared dashboard created earlier by selecting the Pin to dashboard button from the top right corner of the page. Then, select the dashboard name.

Now that we have a query pinned to the dashboard, you will notice it has a generic title and comment below it.

- However, we should rename it to something meaningful that can be easily understood by those viewing it. Then, click the edit button to customize the title and subtitle for the tile, and then click Update. Lastly, a banner will appear asking you to publish changes or discard. Then, click Save a copy.

Reference: Microsoft Documentation