Creating Calculated Tables in Power BI Desktop
Often, you create tables by importing data into your model from an external data source. Moreover, calculated tables allow adding new tables based on data you have already loaded into the model. Therefore, instead of querying and loading values into your new table’s columns from a data source, you create a Data Analysis Expressions (DAX) formula to define the table’s values.
You may define DAX as a formula language for working with relational data, like in Power BI Desktop. Moreover, DAX includes a library with over 200 functions, operators, and constructs, that provide immense flexibility in creating formulas to calculate results for just about any data analysis need. Moreover, calculated table is best for intermediate calculations and data you want to store as part of the model, rather than calculating on the fly or as query results.
Features of Calculated Table
Calculated tables in Power BI Desktop have several features that make them a powerful tool for data modeling and analysis. Some of the key features of calculated tables include:
- Dynamic data: Calculated tables are not stored in the data source, but are created on the fly based on the DAX expression used to define them. This means that they are always up to date with the latest data.
- Customization: Calculated tables can be customized to meet specific business requirements. For example, you can create a calculated table that groups data by multiple columns, applies filters, or calculates complex aggregations.
- Reusability: Calculated tables can be used across multiple reports or dashboards within the same Power BI Desktop file or even across different files.
- Improved performance: Calculated tables can help improve query performance by pre-calculating the results of complex queries and storing them in a separate table.
- Integration with other objects: Calculated tables can be used in conjunction with other objects in Power BI Desktop, such as visualizations, measures, and calculated columns, to create more sophisticated data models and analysis.
How to create calculated tables?
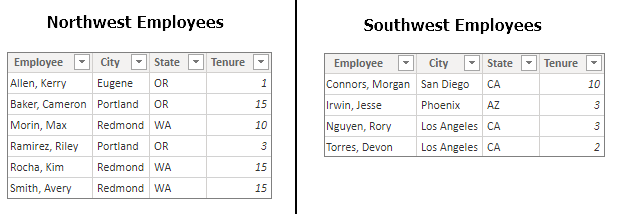
The process of creating calculated tables is performed using the given scenario. Let us suppose you are designated as a manager with a table of Northwest Employees and another table of Southwest Employees. You have been asked to combine the two tables into a single table called Western Region Employees.
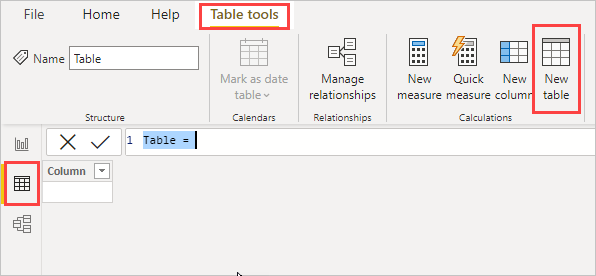
- At first, you will be required to create calculated tables by using the New Table feature in Report View or Data View of Power BI Desktop.
- Then, in Report View or Data View of Power BI Desktop, in the Calculations group of the Modeling tab, select New Table.
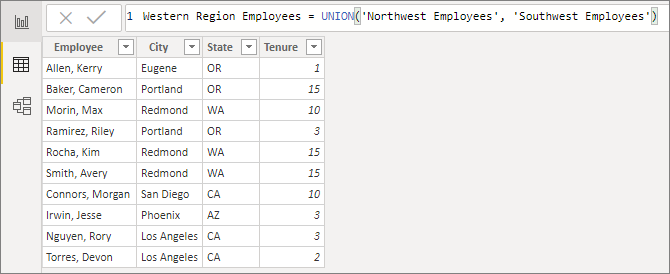
- In the third step, enter the formula in the formula bar:DAXCopy
Western Region Employees = UNION(‘Northwest Employees’, ‘Southwest Employees’)
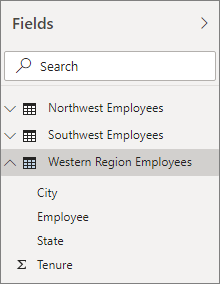
- Thereafter, a new table named Western Region Employees is created and appears just like any other table in the Fields pane.
- You can create relationships with other tables, add measures and calculated columns, and add the fields to reports just like with any other table.
What are the functions for calculated tables?
Calculated tables in Power BI Desktop use Data Analysis Expressions (DAX) formulas to define the table structure and perform calculations on the underlying data. Here are some of the DAX functions commonly used for creating calculated tables:
- FILTER: This function is used to filter a table based on a specified condition. It can be used to create subsets of data or exclude certain values.
- SUMMARIZE: This function is used to group data and calculate summary statistics. It can be used to create aggregated tables that summarize data at different levels of granularity.
- UNION: This function is used to combine two or more tables with the same columns into a single table. It can be used to merge data from multiple sources or create a composite table.
- CROSSJOIN: This function is used to create a Cartesian product of two or more tables. It can be used to create all possible combinations of data from multiple tables.
- ADDCOLUMNS: This function is used to add a calculated column to a table based on a specified expression. It can be used to create new columns with customized calculations.
- CALCULATETABLE: This function is used to evaluate a table expression in the context of a modified filter context. It can be used to apply filters or perform calculations on a subset of data.

DA-100 Exam Practice Questions
Question: You want to create a calculated table that summarizes sales data by year and quarter. Which DAX function should you use?
A. SUMMARIZE
B. FILTER
C. CROSSJOIN
D. UNION
Answer: A. SUMMARIZE
Explanation: The SUMMARIZE function is used to group data and calculate summary statistics. In this scenario, we want to summarize sales data by year and quarter, so we can use SUMMARIZE to group the data by the “Year” and “Quarter” columns and calculate the total sales for each group.
Question: You have two tables, “Sales” and “Expenses”, that have the same columns. You want to combine these tables into a single table. Which DAX function should you use?
A. UNION
B. CROSSJOIN
C. SUMMARIZE
D. FILTER
Answer: A. UNION
Explanation: The UNION function is used to combine two or more tables with the same columns into a single table. In this scenario, we have two tables, “Sales” and “Expenses”, that have the same columns, so we can use UNION to merge them into a single table.
Question: You want to create a calculated table that shows the top 5 products by sales. Which DAX function should you use?
A. FILTER
B. TOPN
C. RANKX
D. ADDCOLUMNS
Answer: B. TOPN
Explanation: The TOPN function is used to return a specified number of rows that have the highest values for a given expression. In this scenario, we want to create a calculated table that shows the top 5 products by sales, so we can use TOPN to return the top 5 rows based on the “Sales” column.
Question: You want to create a calculated table that shows the average sales by category and region. Which DAX function should you use?
A. SUMMARIZE
B. FILTER
C. GROUPBY
D. CROSSJOIN
Answer: C. GROUPBY
Explanation: The GROUPBY function is used to group data and calculate summary statistics. In this scenario, we want to calculate the average sales by category and region, so we can use GROUPBY to group the data by the “Category” and “Region” columns and calculate the average sales for each group.
Question: You want to create a calculated table that shows the total sales for each year and month, but you only want to include data for the last 12 months. Which DAX function should you use?
A. CALCULATETABLE
B. FILTER
C. SUMMARIZE
D. ADDCOLUMNS
Answer: B. FILTER
Explanation: The FILTER function is used to filter a table based on a specified condition. In this scenario, we want to include data for the last 12 months, so we can use FILTER to filter the data based on the “Date” column and include only the last 12 months. Then we can use SUMMARIZE to group the filtered data by the “Year” and “Month” columns and calculate the total sales for each group.