Conditional Formatting for Tables in Power BI Desktop
The conditional formatting for tables in Power BI Desktop has been used to specify customized cell colors, that includes color gradients, depending on field values. Moreover, you can also demonstrate cell values with data bars or KPI icons, or as active web links. Further, you can also use conditional formatting to any text or data field, as long as you base the formatting on a field that has a numeric, color name or hex code, or web URL values. Remember, conditional formatting revokes any custom background or font color that can be applied to the conditionally formatted cell.
Steps to apply conditional formatting
- Firstly, select a Table or Matrix visualization in Power BI Desktop.
- Secondly, in the Fields section of the Visualizations pane
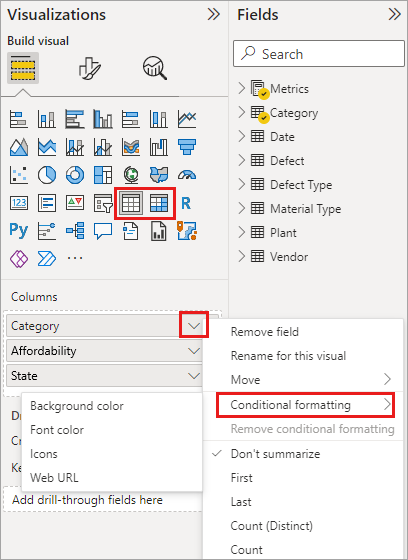
- Then, right-click or select the down-arrow next to the field in the Values well that you want to format.
- Lastly, select Conditional formatting, and then select the type of formatting to apply.
NOTE: In order to remove conditional formatting from a visualization, then select Remove conditional formatting from the field’s drop-down menu. Thereafter, select the type of formatting to remove.
Steps to Format Background or Font Color
Use the steps to Format background or font color –
- Firstly, select Conditional formatting for a field, and then select either Background color or Font color from the drop-down menu.
- In the second step, the Background color or Font color dialog box opens, with the name of the field you’re formatting in the title.
- Then, after selecting conditional formatting options, select OK.
Step to implement Color by color scale
- Firstly, in the Format by field of the Background color or Font color dialog box, select Color scale.
- Secondly, Based on field, select the field to base the formatting on.
- Then, you can base the formatting on the current field, or on any field in your model that has numerical or color data.
- Next, under Summarization, specify the aggregation type you want to use for the selected field.
- Further, under Default formatting, select formatting to apply to blank values.
- Now, under Minimum and Maximum, choose whether to apply the color scheme based on the lowest and highest field values, or on custom values you enter.
- Then, drop down and select the colors swatches you want to apply to the minimum and maximum values.
- Lastly, select the Diverging check box to also specify a Center value and color.
Steps to color by rules
- Firstly, in the Format by field of the Background color or Font color dialog box, select Rules.
- Then, Based on field shows the field to base the formatting on, and Summarization shows the aggregation type for the field.
- Next, under Rules, enter one or more value ranges, and set a color for each one. Such that each value range has an If value condition, an and value condition, and a color.
- Lastly, cell backgrounds or fonts in each value range are colored with the given color.
For More visit: Conditional Table Formatting